Adfonic's Q2 Global AdMetrics Report Shows Android Beating Out iOS as Most Popular Platform for Mobile Advertisers
by Romany Reagan on 24th Jul 2012 in News


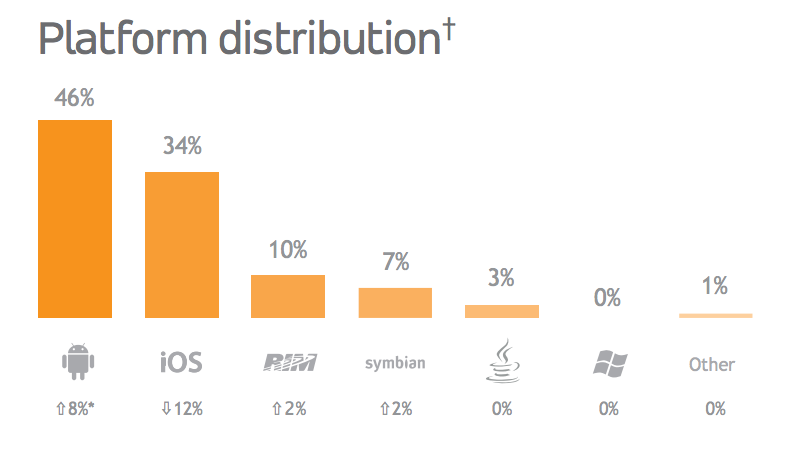
Adfonic released last week their Q2 Global AdMetrics report, the second in a quarterly series, announcing, among other things, Android has beaten iOS for the first time as the most popular platform for mobile advertisers. The report further breaks down metrics by region, device, demographic and vertical.
Paul Childs, CMO of Adfonic, comments: “The growing dominance of Android across Adfonic’s global advertising marketplace reflects wider industry trends that we are seeing from other sources, and highlights widespread consumer adoption of the increasing number of Android-powered devices. Together, Android and iOS devices now account for 80% of Adfonic’s global ad inventory. This is largely because their smartphones and tablets have the most compelling user interfaces, comprising touchscreens, geolocation features and attractive displays. They are fulfilling their tremendous advertising potential to show engaging ad formats, such as rich media.”
Gareth Davies, Commercial Operations Director, Somo Global, adds: "Adfonic's commitment to offering robust and insightful performance metrics, in the form of their Q2 2012 Global AdMetrics Report, is a boon for mobile marketers and benchmarks important demographic and consumer trends in mobile. The significant CTR uplift from gender, geo and channel targeting highlight the significant value buyers achieve with targeted media buys, a real focus for Somo as we plan and optimise against a wide range of KPIs for our broad range of forward thinking, global brands. Given the need for more transparency in mobile media, and the value of data driven insights, Adfonic's recent report is most welcome."
The Adfonic reports are based on tens of billions of ad requests processed monthly by the Adfonic marketplace. The Q2 2012 report draws from analysis of thousands of mobile advertising campaigns, spanning almost fifteen thousand mobile sites and apps.
Highlights
• Android overtakes iOS to become the most popular platform for mobile advertisers. For the first time Adfonic’s global marketplace shows that Android increases its share from 38% in Q1 to 46% in Q2, while iOS declines from 45% in Q1 to 34% in Q2.
• There are ‘sweet spot’ combinations of advertiser campaign verticals and publisher inventory channels. Some combinations produce exceptionally high clickthrough rates (CTRs) and effective earnings per thousand impressions (eCPMs). For example, news sites that show ads for style and fashion can increase eCPMs eightfold.
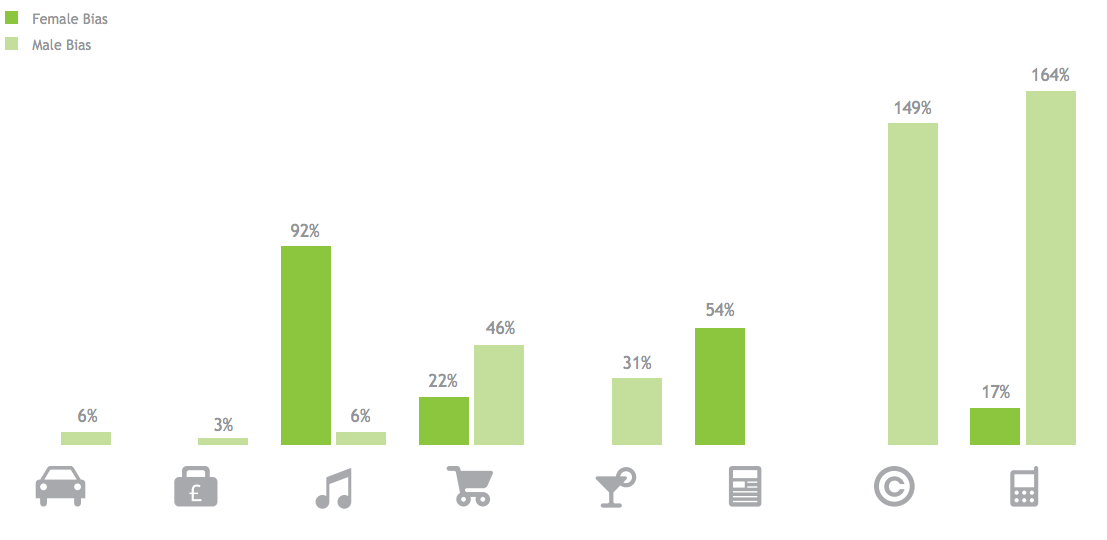
• Gender targeting drives improved performance. Gender-targeted campaigns are far more likely to deliver above-average CTRs. For example, at the global level, there is a 164% uplift in tech and telecoms campaigns that are male targeted.
Globally, Adfonic’s total ad requests increase 15% quarter on quarter, with 8,256 active campaigns in Q2. Europe experiences the strongest growth, currently standing at 23 billion ad requests, a change of 34% quarter on quarter that enables it to surpass North America for the first time. Globally, the Android platform continues to surge ahead, surpassing iOS for market share and ad impressions.
There is a significant male bias in Adfonic’s North American, European and Asian markets, accounting for 58% of ad requests on iOS and Android. However, the global gender split is almost equal. The 20-29 year-old age group accounts for 50% of all consumers.
Platform mix per region
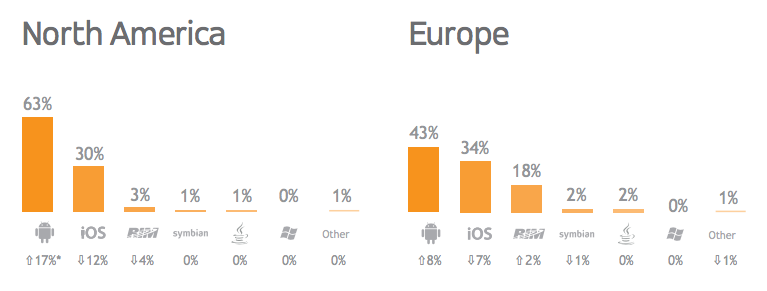
Android gains market share in both North American and Europe, with 63% and 43% of all ad impressions respectively.
Top Devices & Platforms
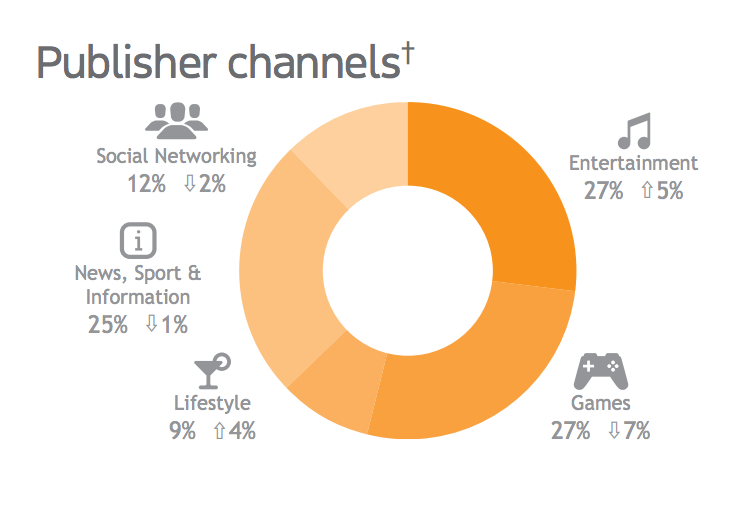
Ad requests become more evenly distributed across channels, providing advertisers with diverse audiences. The Entertainment, Media and Technology audiences combined account for two-thirds of advertiser spend.
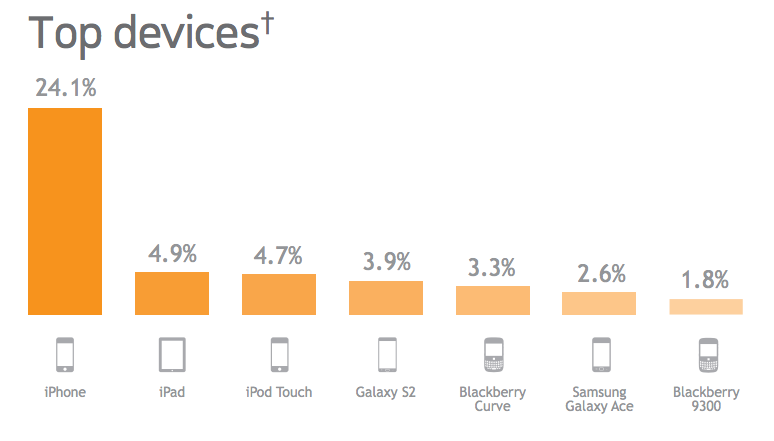
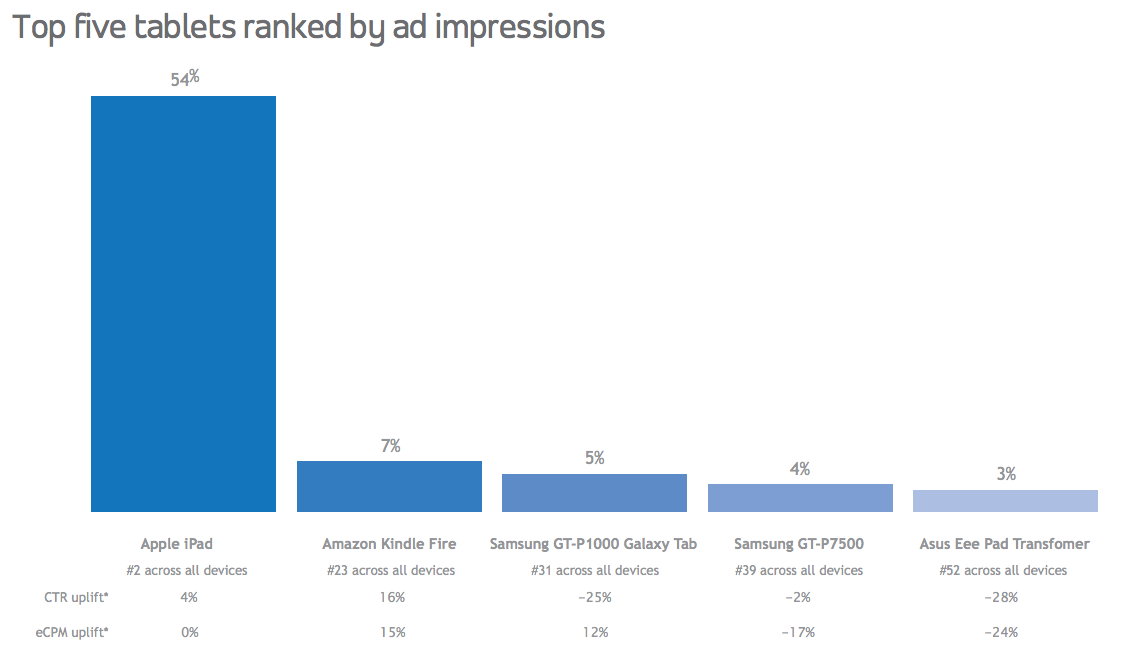
The iPad captures 55% of all tablet impressions, while the Android market is still very segmented. Within Android, the Kindle Fire continues to gain share and shows above-average CTR and eCPM performance.
Top Devices & Platforms: North America
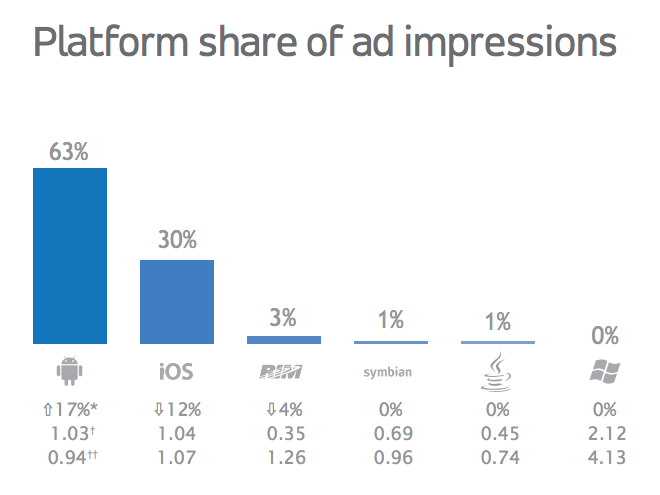
The tablet format slowly increases its share to 11%. Android is dominant by a high margin, with 63% share compared with iOS at 30% share. The Amazon Kindle Fire is carving more space in the overall league of devices.
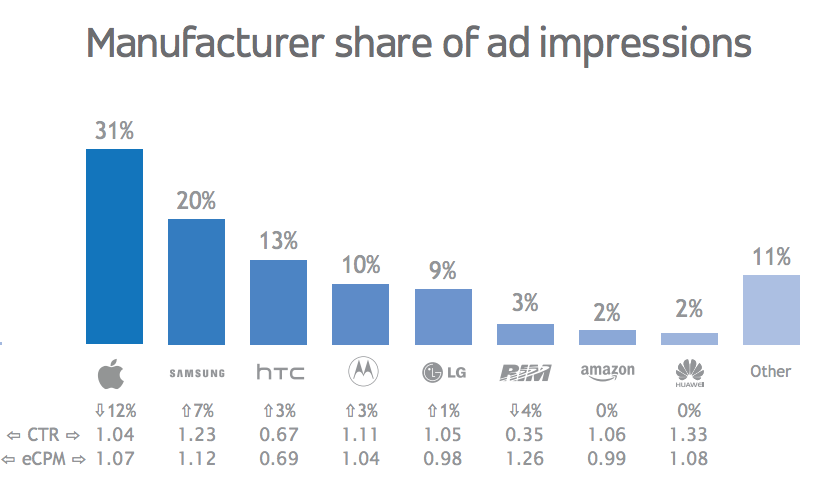
The Kindle Fire is second to the iPad in volume of impressions but is far above in terms of CTR and eCPM. The iPhone loses 8% market share this quarter, but still generates 15% above-average CTR performance.
Top Devices & Platforms: Europe
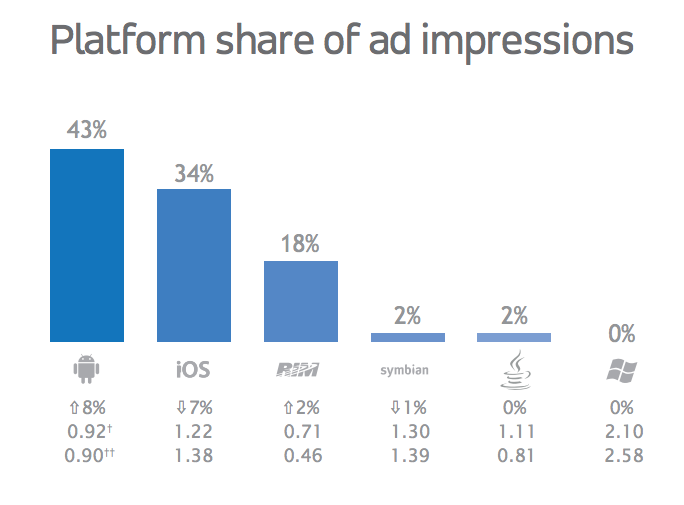
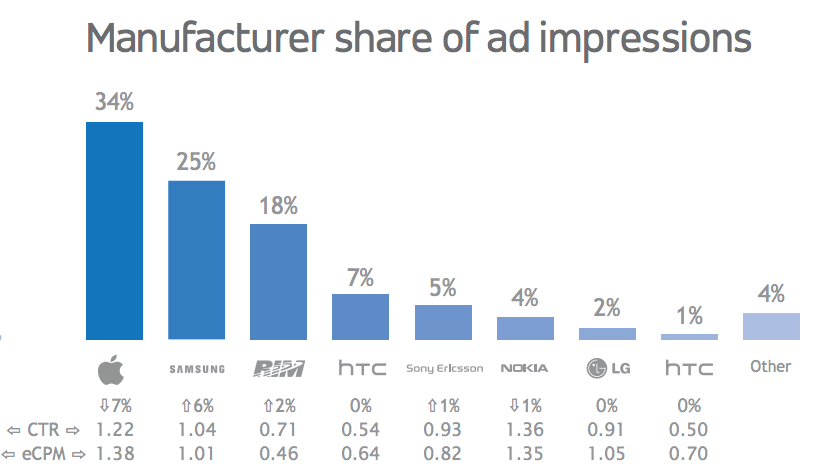
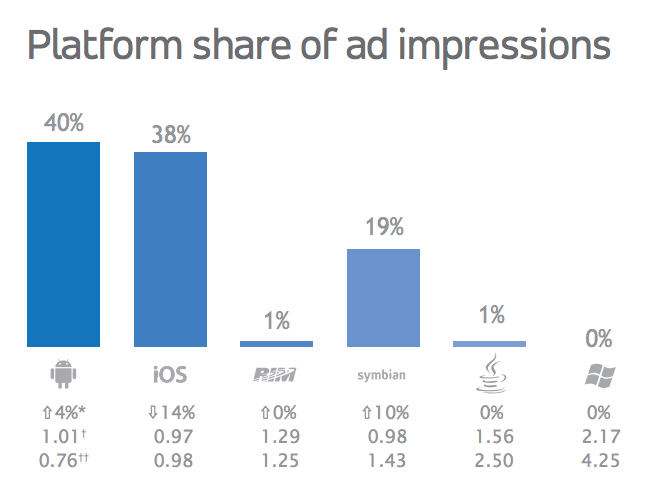
The Android platform takes 8% market share away from iOS, which however still commands a signifi cant eCPM premium of 53% over Android. RIM still maintains a significant share in Europe (18%), where Blackberry Messenger is popular with younger demographics.
Of the top ten European devices, Apple devices achieve the highest CTR and eCPM.
Top Devices & Platforms: Asia
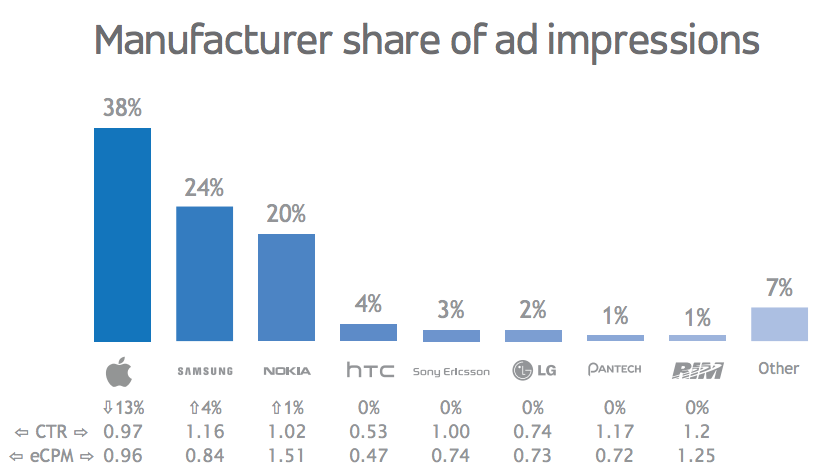
Nokia and Symbian hold around one fifth of the market and achieve high eCPMs, +43% higher than the Asia average.
Apple devices lose share to Android and Symbian. The iPhone loses 11% share, and the iPad loses 16%.
Top Devices & Platforms: Africa
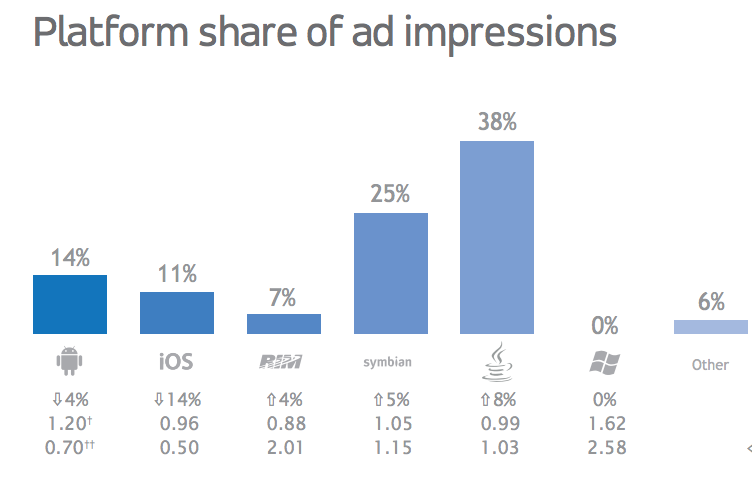
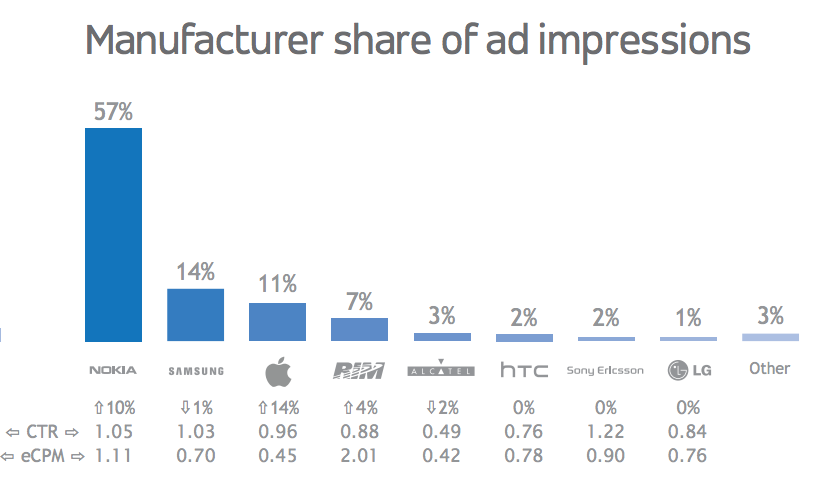
The Java and Symbian platforms increase their dominance, with a combined 63% of the market, against 50% last quarter. Nokia, the most recognised brand in Africa (source: The Economist), accounts for 57% of all ad impressions in Q2.
Despite Nokia’s overall market share, Apple and RIM take the top two positions in an extremely fragmented market, with RIM more than doubling the average eCPM.
Focus on Apple
While iPhones and iPads are still used primarily for games, with 47% and 56% of ad requests respectively, the iPod Touch includes the largest proportion of Social Networking users (24%). The iPad achieves the highest CTR (+17%) across all Apple devices, particularly on the Games channel (+59%).
Focus on Tablets
Mix of Verticals
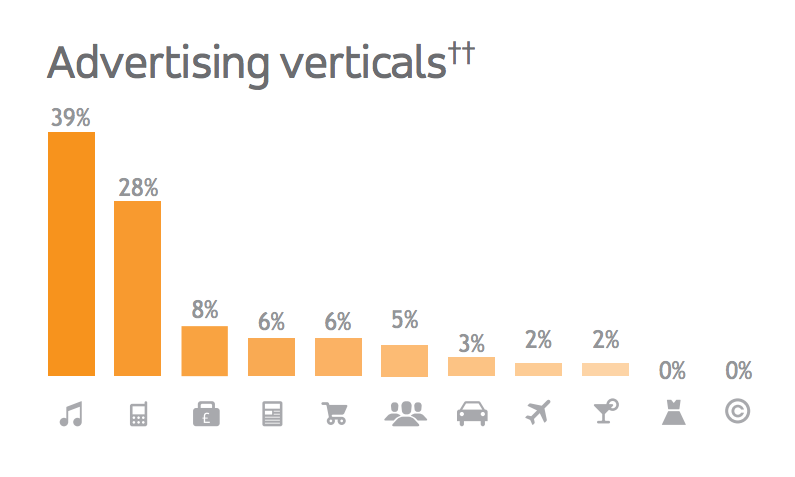
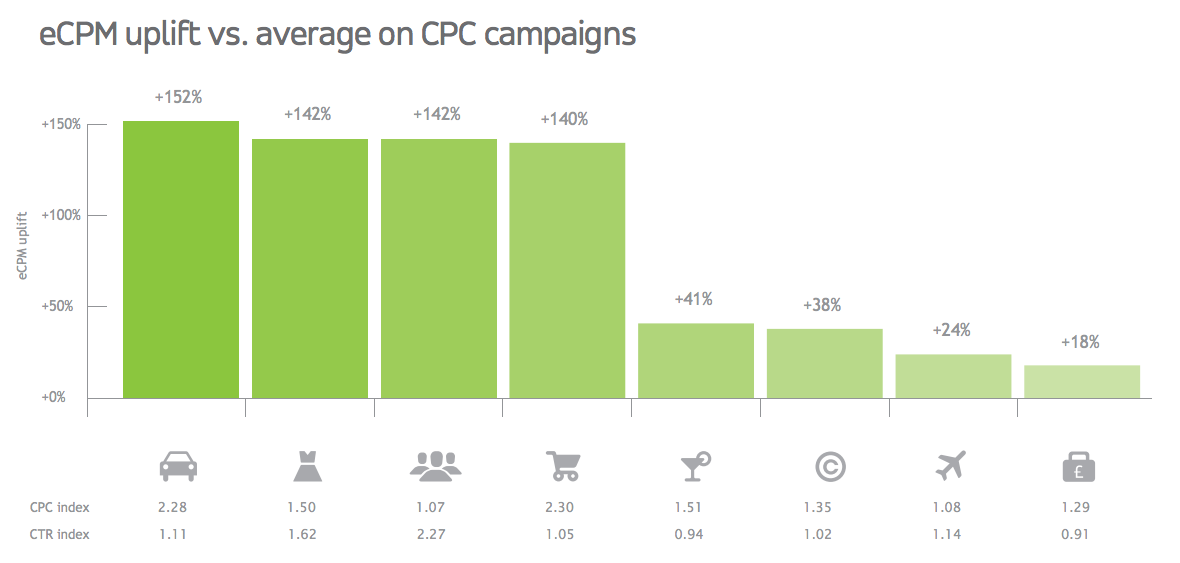
Entertainment and Technology together drive 67% of spend. Entertainment & Media achieves a conversion rate 260% above average, with consumers keen to install media-related apps. Business & Finance and FMCG & Retail command CPCs 29% and 130% above average. Social & Dating delivers the highest CTR performance, 127% above average, while Style & Fashion campaigns deliver 62% above average. Automotive delivers the highest eCPM, at 152% above average, and a 127% higher CTR.
In North America, the News & Education vertical takes third position in North America, where it achieves +26% CTR. The Business & Finance vertical can be expected to pay about 2.5 times the average CPC, to reach a valuable mobile audience with targeted messages.
In Europe, Entertainment & Media achieves an impressive conversion uplift of 707% above average, followed by Business & Finance (+117%). FMCG, Lifestyle and Automotive command higher CPC prices, 100%, 119% and 89% above average respectively. Travel is a popular vertical, with +53% CTR.
In Asia, Entertainment & Media drives 50% of spend, achieving an impressive +42% conversion rate uplift. Technology & Telecoms follows with CTRs 52% above average. Social & Dating is promising, with a CTR 139% above average, while FMCG places higher value on mobile consumers, with CPC 177% above average.
In South America, Entertainment & Media makes up 50% of the advertising spend and achieves some of the highest CTRs (45% higher than the average)followed by Travel (+24%). The Social & Dating vertical commands higher CPC prices (+33%).
In Africa, 69% of the advertising spend in Q2 comes from the Technology & Telecoms vertical, while FMCG & Retail campaigns generate an eCPM 214% higher than the average.
Pricing & Performance Per Vertical
The eCPM from the top verticals (Automotive, Style & Fashion, Social & Dating and FMCG & Retail) is 140% above average, driven by higher CPCs and CTRs, which means publishers providing content relevant to these audiences can expect effective monetization.
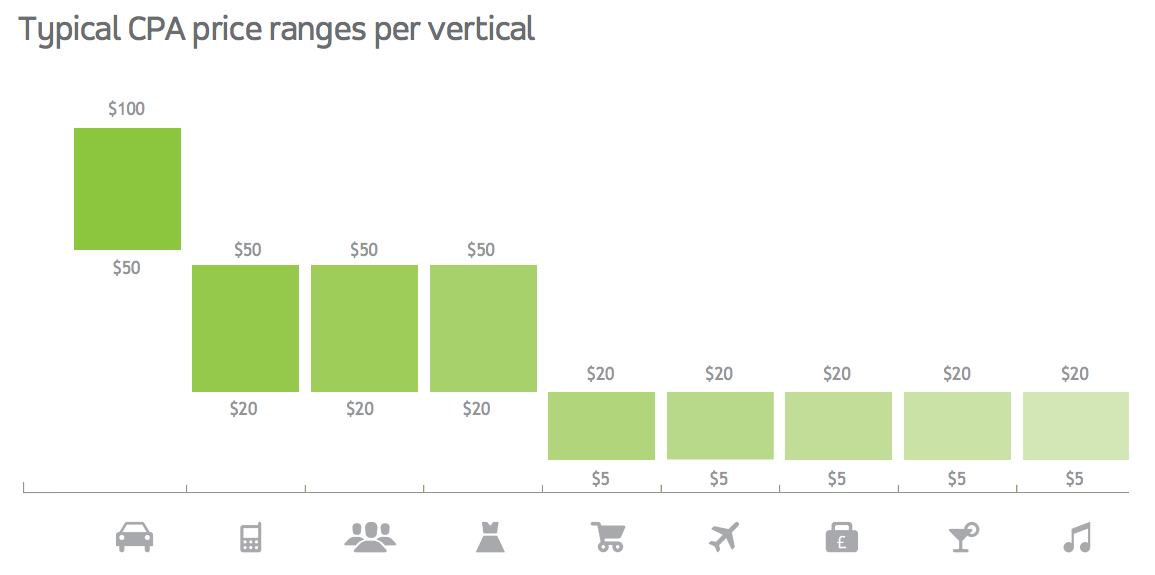
The ability to reach high-value consumers on mobile platforms is increasingly valuable. This refl ects the price point range for conversiondriven campaigns. High-value verticals like Automotive command $50-$100. Most verticals acquire customers at a cost proportionate to the typical customer lifetime value for their industry.
Pricing & Performance Per Region
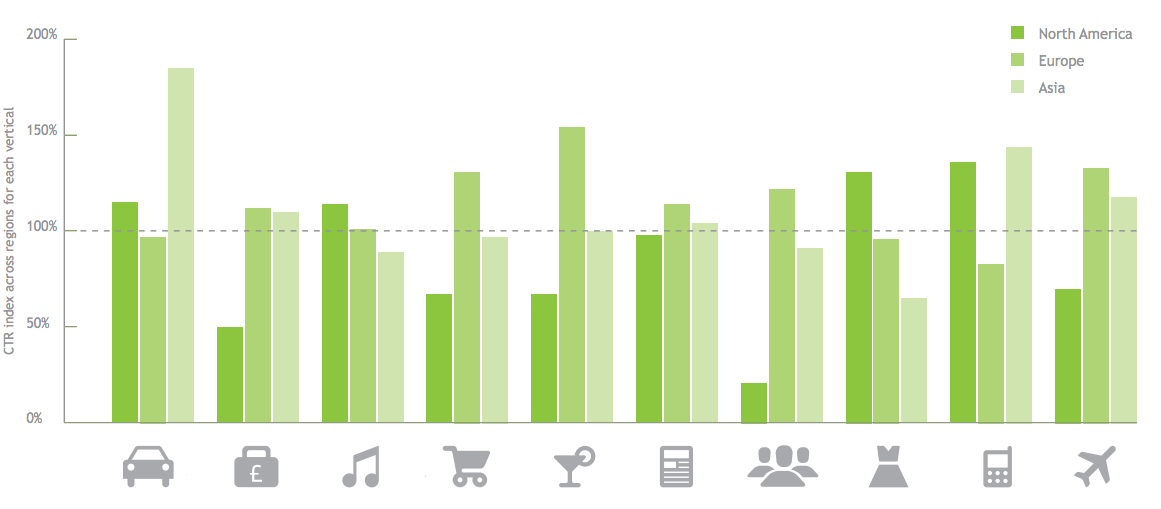
CTR performance varies signifi cantly across regions, refl ecting cultural and creative differences. The most popular verticals in Europe are FMCG & Retail (31% higher CTR than other regions), Lifestyle (+55%), Travel (+33%) and Social & Dating (+23%). In North America, Technology & Telecoms generates +37% CTR, then Style & Fashion (+32%), Entertainment & Media (+15%) and Automotive (+15%). In Asia, Automotive generates +85% CTR, followed by Technology & Telecoms (+45%) and Travel (+19%).
Price Performance Increase From Gender Targeting
Gender targeting provides a CTR uplift to advertisers with customized creatives and targeted messaging. Male targeting yields a 164% uplift for Technology & Telecoms campaigns, while female targeting provides a 92% uplift on Entertainment & Media. For FMCG & Retail, gender-specific targeting increases CTR by 22% for females and 46% for males.
Performance Increase From Time Targeting
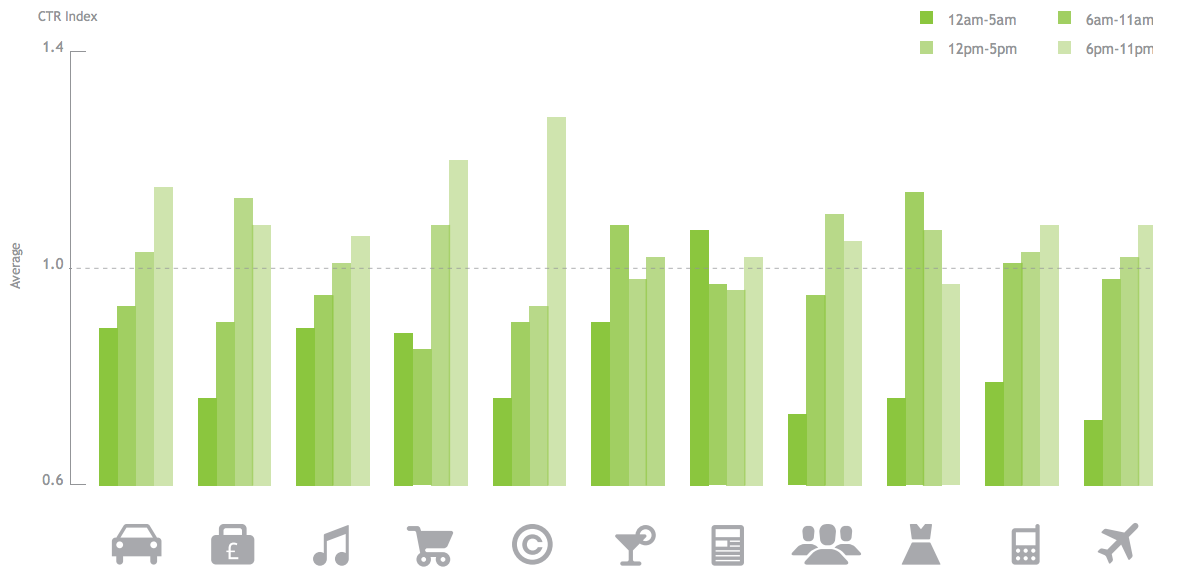
CTR rates generally peak after 6pm for Automotive (15% above average) and FMCG & Retail (20%). Style & Fashion and Lifestyle & Health achieve higher morning CTRs, and only News & Education achieves higher performance between midnight and 5am (+7%).
Price Performance by Day of the Week
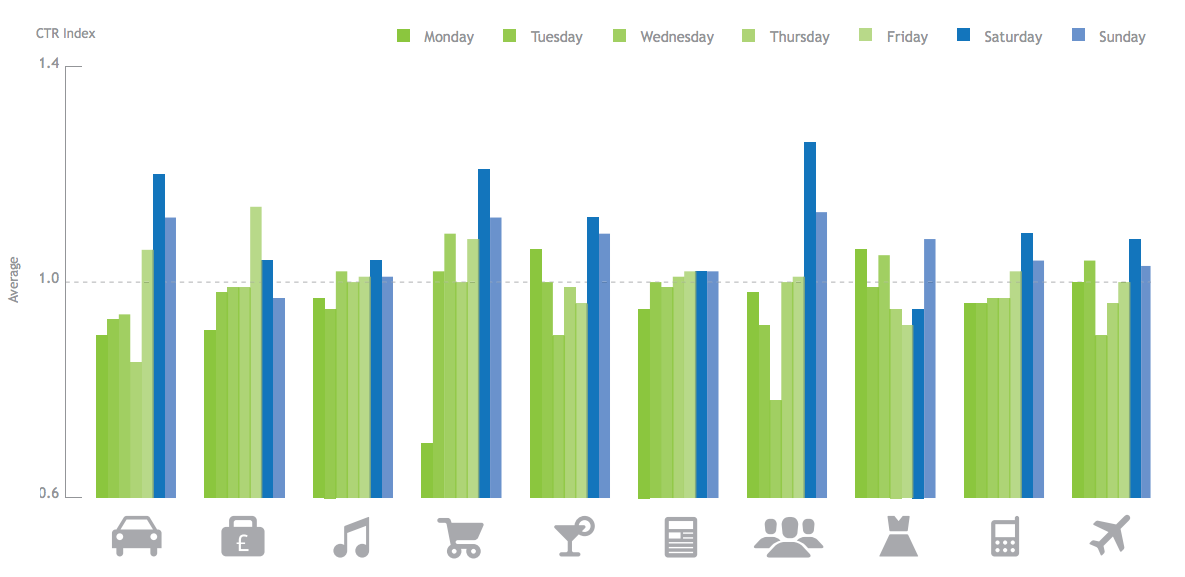
Performance increases on Saturdays (6% above average), in particular for Social & Dating (+26%), FMCG & Retail (+21%) and Automotive (+20%). Monday has the lowest CTR (-5%), except for Lifestyle & Health (+6%) and Style & Fashion (+6%). During the working week, Wednesday is the best day for FMCG & Retail (+9%), and the worst for Social & Dating (-22%).
Audience Per Channel
The Games channel still achieves the best CTR performance (28% above average), while social networking has the lowest (62% below). Despite an average CTR, Lifestyle delivers the highest eCPMs at 80% above average. The Games channel provides access to younger audiences, with 56% of consumers in the 14-19 age group, and 30% of them in their 20s. At either end of the age ranges, those below 20 and above 60 are mostly female. The 20-59 age group is mostly male.
Audience Per Platform, Region and Day Part
Males account for 60% of audience on most platforms. The exception here is Symbian, where devices are more typically owned by females (+65%). Gender mix is male-biased except for Europe, where it is balanced. Males are more active in the morning, females in the evening.
Teenagers show the highest propensity to click (29% above average) and convert (+54%). The 40-59 group clicks less often than average (22% below) and converts more post-click (+52%). Men click 3% more often than women, but women convert 31% more frequently.
Vertical Performance
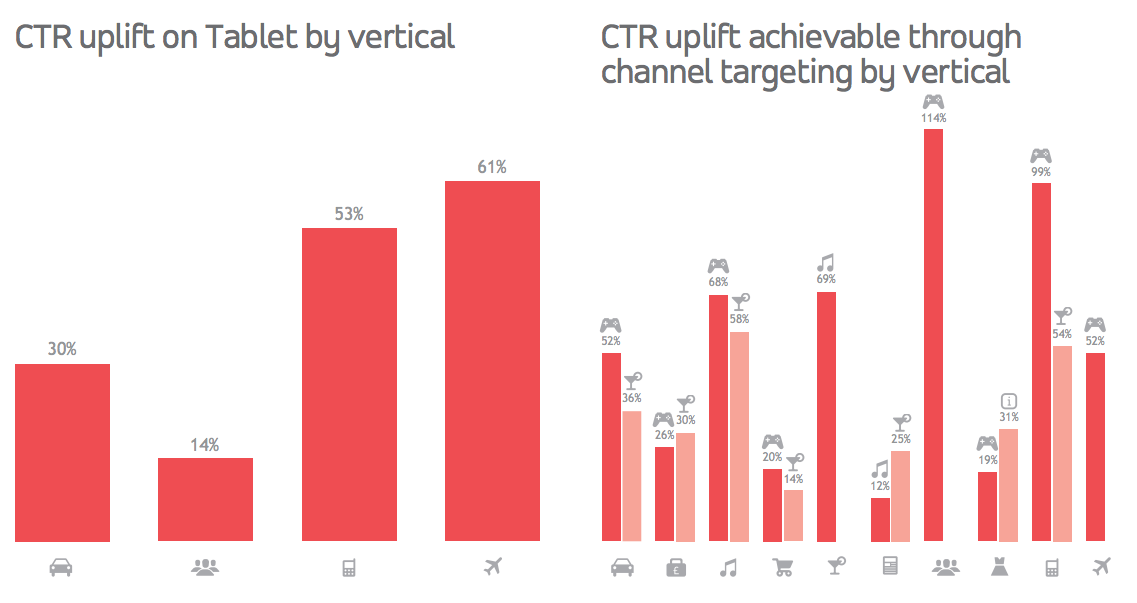
The tablet’s larger real estate boosts CTRs – travel campaigns on tablets show a 61% uplift. Tech & Telecoms, Automotive and Social & Dating also perform well on tablets. The Games channel delivers most clicks, and Lifestyle, Entertainment and News deliver impressive CTR uplifts.
Ad NetworkDataDisplayExchangeMobileProgrammaticTargeting



Follow ExchangeWire