Global Bot Fraud to Cost USD$7.2bn in 2016; TV no Longer Dominant Screen
by on 18th Feb 2016 in News

ExchangeWire Research’s weekly roundup brings you up-to-date research findings from around the world, with additional insight provided by Rebecca Muir, head of research and analysis, ExchangeWire. In this week’s edition: global bot fraud to cost USD$7.2bn in 2016; TV no longer the dominant screen; and branded content sees falling engagement rates.
Bot fraud to cost USD$7.2bn globally in 2016
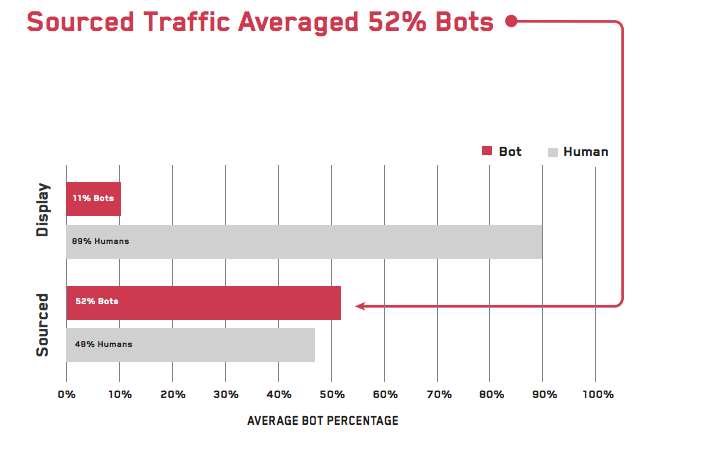
Globally, bot fraud is predicted to rise 14.3% year-on-year, costing brands USD$7.2bn (£10.3bn) in 2016, according to research from White Ops. Over two thirds (67%) of bot traffic observed in the study came from residential IP addresses; bots were found to click more often than humans, but not improbably more often.
Bot traffic accounted for just under a quarter of all video traffic (23%), whilst bot traffic in programmatic inventory averaged 17%. Approximately half of bots continued to operate throughout the night, with average bot percentages highest at around 2am (26%).
More than half (52%) of sourced traffic came from bots, with 11% of display traffic generated by bots.
TV losing dominance
In the UK, half of adults stated that a TV is the focal point on their living room, according to research from the IAB UK. Seven-in-ten adults reported using a connected device whilst watching TV, with the figure rising to 87% for those aged 16-34.
Over one third (34%) of adults check emails whilst watching TV, 31% use instant messaging services, and one-quarter shop online. Biometric data analysis revealed that consumers were most engaged during a TV session when conducting a non-TV related activity.
Tim Elkington, chief strategy officer, commented: “Second screening is ingrained to such a degree that all screens are now equal, there’s no hierarchy, only fragmentation of attention – actually switch-screening is a much more accurate term.”
The incidence of checking emails was consistent during TV programmes and ad breaks (34%), whilst texting or instant messaging was just 1% higher during ad breaks than programmes. This finding challenges the assumption that people cram their non-TV related behaviour into ad breaks.
Using a connected device (35%) was the most popular activity carried out during TV ad breaks, followed by talking to others (15%) and leaving the room (13%). Just 5% of adults reported that they watched TV ads in full.
Social media brand output increasing
In 2015, the output of content per brand on social platforms increased by 35%, but consumer engagement fell 17%, according to research released by TrackMaven. Content per brand rose by 60% on Twitter and 31% of Facebook.
In October 2015, consumer engagement on social media dropped to a low of 2.19 interactions per 1,000 followers, coinciding with a spike in branded content. This finding highlights a quantifiable content overload for consumers.
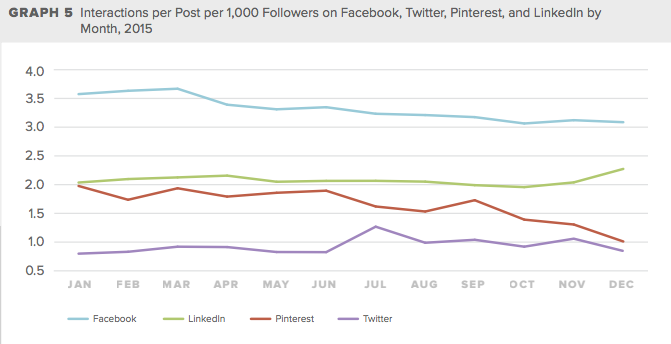
Content on Facebook gained the highest number of interactions – the only social media platform to consistently provide over three interactions per 1,000 followers – followed by LinkedIn (2-2.3). Across 2015, the average engagement ratio per post on Pinterest fell 49%. This may be explained by the average number of monthly pins per brand increasing 27.8%, from 72 to 92.
The average number of blogs per brand per month decreased 16% across 2015, reaching a low of 58. Engagement with brand blogs, remained steady across the year reaching a peak of 190.7 average social shares per post in July 2015.
Ad FraudCross-DeviceSocial MediaTV


Follow ExchangeWire