Measuring Ad Annoyance: How Our Perceptual System Processes Ads
by Lindsay Rowntree on 13th Jun 2016 in News

Ad annoyance is cited as a primary reason for the widespread use of ad blockers. Often, the very characteristics that make ads more noticeable also make them more annoying. In this feature, ExchangeWire speak with Paolo Gaudiano (pictured below), chief technology officer, Icosystem, about a neuromarketing experiment, done in collaboration with Light Reaction and SPARK Experience, to measure the attention and emotional response of subjects exposed to banner ads and interstitial ads. Their findings reveal that the attention generated by the interstitial format may not warrant the level of annoyance that these ads generate. The results of their experiment and a live neuromarketing demonstration will be presented for the first time tomorrow (14 June) at the Advertising Research Foundation’s Audience Measurement conference in New York.
A lot of effort in digital advertising focuses on delivering the right ad to the right audience at the right time. However, the narrow focus on audience targeting misses an important point: before we can evaluate an ad at the cognitive level, the ad must be processed by our perceptual system; and that processing is influenced by physical characteristics such as color, brightness, contrast, size, and so on. To explore these issues, Light Reaction and Icosystem recently developed Perceptual Science, a framework to study how our perceptual system processes ads.
As part of our research, we identified a series of stages that an ad must cross in order to generate a response. First, we must notice the ad; next we must pay attention to it; as soon as we pay attention, we have an emotional 'gut reaction'. Only after an ad crosses these precognitive stages, will we process its content at the cognitive level to determine whether it is relevant, timely, and so on. Ads that fail to cross any of these stages will result in a lost opportunity.
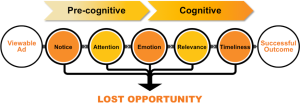
Figure 1: The Perceptual Pathway
In some cases, changing certain characteristics of the ad can impact its chances of crossing more than one stage. For instance, adding animation to an ad increases the probability that the consumer will notice and pay attention to it. However, in some cases, the same change can have an opposite impact on different stages: using the same example, animated ads are known to be annoying, i.e., they can generate a negative emotional reaction in the third stage of the Perceptual Pathway.Anything that can be done to improve the probability of crossing these stages will increase the overall probability of generating a response. For example, if an ad is twice as likely to be noticed, then it should be twice as likely to yield a response.
The question then becomes: how can we measure the attention and emotional reaction to an ad? And how do we explore the quantitative relationship between an ad’s characteristics, the emotional reaction it generates, and the resulting performance?
We recently had the opportunity to begin answering these questions by conducting our first Neuromarketing experiment in collaboration with SPARK Experience. We focused on a simple but clear-cut experiment: measure the attention and emotional reaction to ads while reading news on a mobile device. We compared the results of two ad formats: banner ads interspersed within an article, and interstitial ads that cover the entire screen and require the user to close them in order to continue reading.
Our hypothesis was that interstitial ads have a greater probability of being noticed and attended to, but should generate a more negative emotional reaction, i.e., they should be more annoying. But how much more annoying? Is the increased attention worth the negative emotional reaction?
The experiment set up
For our experiment, SPARK Experience designed a mock mobile news site and a series of mock ads. The ads did not use real brands and they avoided using imagery, factors known to influence emotions. The interstitial ads were simply the banner ads placed within a lightbox covering the entire screen (Figure 2). We used the same size ad to remove extraneous factors and focus strictly on the presentation format.

Figure 2: Sample banner (left) and interstitial (right) ads.
After setting up each subject and establishing their emotional baseline, subjects were asked to explore a mobile news site while we measured several indicators of their attention and emotional level, including EEG, heart rate, Galvanic Skin Response, and eye tracking.We recruited 30 subjects through a professional recruiting firm, drawn from a heterogeneous population, in order to avoid biases. This choice also reflects our underlying assumption that the early stages of the Perceptual Pathway reflect perceptual processes that are universal, in the sense that they apply to the general population.
Results of the experiment: attention and emotion
The first thing we wanted to measure was the amount of visual attention paid to each ad format, based eye-tracking data. Specifically, we measured the amount of time that the subject’s gaze was over each ad.
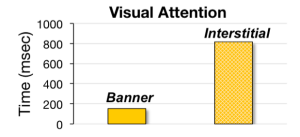
Figure 3: Visual attention (in msec) for banner and interstitial ads
To measure the emotional response, we used a combination of EEG and other biometric signals through Brainwave, a proprietary algorithm developed by SPARK Experience. As Fig. 3 shows, subjects spend significantly more time looking at the interstitial ads than at the banner ads – a ratio of nearly 5:1.
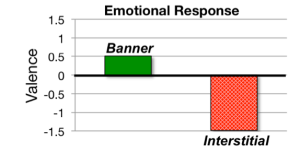
Figure 4: Strength of the emotional response for banner and interstitial ads
Superficially, then, the results of Figs. 3 and 4 seem to support our original hypothesis that the interstitial ads generate more attention because they are impossible to ignore; but, by the same token, they also are more annoying. As shown in Figure 4, subjects exhibited a slight positive emotional reaction to the banner ads, and a stronger, negative reaction to interstitial ads.
However, when we began to look more closely at the results, we found that this is only part of the story.
Eye tracking as an indicator of attention
During the experiments, we noticed that, when an interstitial ad appeared, subjects seemed to be looking immediately for the X to close it, as seen clearly in Figure 5.
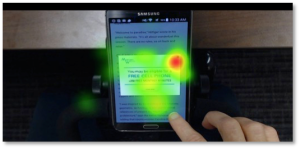
Figure 5: Heat map showing the amount of time spent on various portions of the screen
Furthermore, we had noticed that subjects took the most time closing the first interstitial ad they saw, and then quickly figured out how to close subsequent interstitial ads. Figure 6 shows the eye tracking data for the first and third interstitial ad across all subjects.
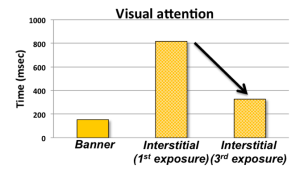
Figure 6: Visual attention (time spent looking at the ad) for the first and third exposures to interstitial ads.
As is evident from the results, even by the third exposure, subjects spent significantly less time looking at the interstitial ads. In fact, the time spent looking at the third interstitial ad was only about twice as long as the time spent looking at banner ads.
Taken together, the results of Figs. 5 and 6 suggests that, although the interstitial ads appear to garner more visual attention, in fact, that additional attention is dedicated primarily to figuring out how to close the ad.
This finding led us to a further analysis of the attention paid to interstitial ads.
Visual attention versus cognitive processing
It well known from academic research that there are different forms of attention. Eye Tracking reflects visual attention, but even when a person is gazing at something, it does not mean that the person is actually paying attention at the cognitive level.
SPARK’s Brainwave software, in addition to extracting emotion, can also measure the amount of cognitive processing – roughly speaking, a measure of how much the subject’s brain is engaged by the ads.
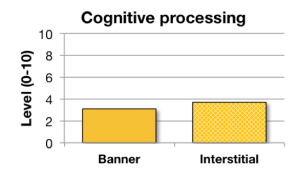
Figure 7: Amount of cognitive processing measured from EEG in response to banner ads and interstitial ads
Taken together with our earlier findings, these results suggest that, although interstitial ads appear to be garnering more attention than banner ads, in reality, that attention reflects the subject’s desire to close the interstitial ad, rather than any expenditure of cognitive processes to analyse the ad’s content. Figure 7 shows that the level of cognitive processing is nearly identical for banners and interstitials; and, in fact, the difference is not statistically significant.
In summary
 Although we are by no means the first to carry out neuromarketing experiments, we believe that our work is pioneering in its effort to combine theoretical and experimental approaches, in the framework that we have named 'Perceptual Science'. Given the nearly infinite number of ways of manipulating ads (size, colour, placement, format, animation, sound, imagery, ...), a systematic framework, such as Perceptual Science, is invaluable in guiding us to identify the most promising areas for research and experimentation.
Of course, as is often the case with early studies, our research has generated more questions than it has provided answers. For instance, although we were careful to create a setup that was as similar as possible to a natural mobile browsing experience, we cannot guarantee that the same results would obtain in a real-world campaign. Also, how do the physiological responses we measured translate to campaign performance?
Our next goal is to take the results we have obtained in a laboratory setting, and compare them to results obtained with live campaigns. Light Reaction has recently partnered with a key client to execute a mobile advertising campaign mirroring the one we used in this experiment, with identical banner and interstitial ads.
By comparing the results we obtain in the real campaign with the emotion and attention values we obtained in the present experiment, we hope to be able to shed light on the role played by the early stages of the Perceptual Pathway in the overall performance of these two ad formats.
Ad BlockingDigital MarketingDisplayProgrammatic


Follow ExchangeWire