Which Display Ad Exchange Sells the Highest Quality Inventory?
by Ciaran O'Kane on 12th Feb 2013 in News

Douglas de Jager is founder at spider.io.
Display ad exchanges have traditionally set out to solve a particular pain for advertisers: fragmented access to display ad inventory. Exchanges allow advertisers to buy ad inventory from a single source, an ad exchange, rather than engaging independently with each of the disparate underlying ad networks and publishers.
Until now the onus of selecting the best ad inventory from an exchange’s more abundant supply has been left to the advertiser. Indeed, the recent push toward real-time bidding has ostensibly been about empowering advertisers still further to choose the best available inventory. Between ad exchanges the battle has largely been about which ad exchange can grow its supply of ad inventory as quickly as possible.
In this article we see that advertisers do not have the tools necessary to select the best inventory across ad exchanges. Advertisers are buying ad inventory at scale across lower quality publishers without the ability to improve their selection of inventory. This means that advertisers continue to achieve lower ROI (return on investment) across ad exchanges than they could potentially achieve. With lower ROI, advertisers spend less.
This limitation on the part of advertisers has led to a new battle being waged between the leading ad exchanges. No longer is the volume of supplied inventory the only focus. The leading ad exchanges are now also competing on the relative quality of supplied ad inventory.
In this article we see how one of the most forward-thinking ad exchanges is looking to use ad viewability measurement to identify low quality publishers and thereby to improve ROI for its advertisers. In collaboration with spider.io, this exchange has learnt that it could potentially improve CTR (click-through rate) for its performance advertisers by ∼50% by (i) iteratively shifting advertiser spend from low quality publishers to high quality publishers within the exchange and by (ii) working with publishers who have broken or suboptimal ad integrations rather than having inherently low quality inventory.
Because the exchange has limited access to conversion (and action) data, the potential increase in attributable conversions due to improved inventory quality has not been investigated yet.
This article comprises three further sections. In the first section we consider how an ad exchange can use ad viewability measurement to improve ROI for its advertisers. In the second section we consider the statistics according to which advertisers cannot independently improve ROI for themselves. In the third section we offer some concluding thoughts.
Improving ROI for Advertisers
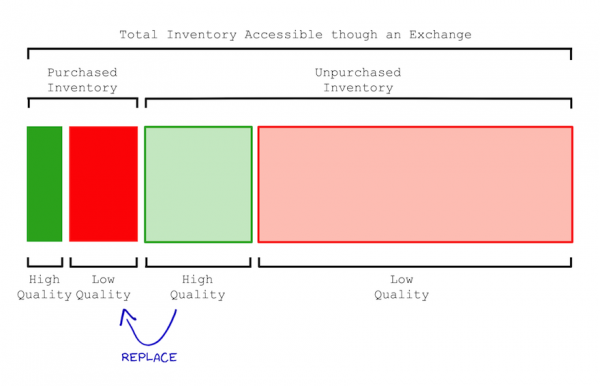
Advertisers typically only buy a fifth of the ad inventory available through any ad exchange, and they are currently failing to select the best quality inventory. Because advertisers are not able to measure differences in inventory quality between publishers, advertisers are also currently not pricing their CPM bids appropriately.[1,2] This means that advertisers are currently failing to maximise the ROI they achieve through ad exchanges.
At the end of 2012 the buying patterns of advertisers were analysed across a leading ad exchange. Despite the enormous volume of available ad inventory, hundreds of billions of ad impressions available each month, advertisers were found to be buying at scale across publishers with low quality ad inventory. In particular, ∼60% of the ad impressions bought by advertisers were across publishers with troublingly low ad viewability rates.
If an ad impression is not viewable then it can deliver no genuine value to an advertiser. So it came as no surprise that the average CTR achieved across the set of low quality publishers was less than a half the average CTR achieved across the remaining ∼40% of purchased inventory. The more interesting discovery was that after filtering programmatically generated clicks and accidental clicks out of the analysis, average CTR across the low quality publishers was less than a tenth of the average CTR across the high quality publishers.
Firefox plugins were a particularly surprising contributor of programmatically generated clicks. For example, InvisibleHand (bit.ly/14LGGJi) is a Firefox plugin which programmatically follows hyperlinks within a webpage independent of whether the content associated with the hyperlink is viewable.
Armed with this knowledge, the ad exchange is now in a position to blacklist low quality publishers and shift advertiser spend to higher quality publishers. The exchange is also in a position to help publishers with broken or suboptimal ad integrations as opposed to inherently low quality inventory.
By increasing ROI for advertisers—by increasing the value delivered—the exchange will be able to sell more to existing advertisers, as advertisers switch spend from other exchanges and other advertising channels, and the exchange will be able to win over new advertisers by making target ROI easier to achieve.
The Problem of Data Sparsity
In this section we consider why the tools advertisers use are unfortunately too coarse-grained to identify the quality of individual publishers within an exchange for anything other than the most trafficked domains.
Let us suppose that an advertiser is optimising for view-through conversions. Let us suppose also that the advertiser is targeting a view-through conversion rate of 0.005% relative to the number of impressions served.
To be confident of achieving the target view-through conversion rate across a particular publisher, this advertiser could have to buy just under five and a half million impressions across this publisher with a fixed creative.† The creative would need to be fixed because conversion rates are dependent on ad creative.
Because conversions are so sparsely distributed across ad impressions — and because conversions often happen days after the associated ad impressions—some advertisers have developed sophisticated prediction and pricing models.[3] Other advertisers simply use ad clicks as a proxy for conversion likelihood, because optimising for clicks reduces the associated sparsity by an order of magnitude.
Let us suppose that an advertiser is optimising for CTR. Let us suppose also that the advertiser is targeting a CTR of 0.1%. To be confident of achieving the target CTR across a particular publisher, this advertiser could have to buy just over 270,000 impressions across this publisher with a fixed creative. At an average CPM of $0.50, this translates to a million dollars buying statistically significant insights across just over 7,600 publishers.
Of course, not all pages within a publisher’s website are alike. In fact, within any single webpage, not all ad placements are alike. For example, the ad placement at the top right of this high quality Gigaom page, bit.ly/Xt9uRJ, is markedly different to the ad placement at the bottom right of the comments on the same page.
This means that advertisers should not be looking to identify inventory quality differences across publishers. Advertisers should in fact be doing significantly more fine-grained differentiation of quality at the placement and URL level.
Unfortunately the more fine-grained the analysis becomes, the more sparse the data becomes. For example, if an advertiser was looking to optimise for CTR across pairs, the advertiser would need just over 270,000 impressions for each pair—as opposed to 270,000 impressions for each publisher.
Let us now contrast the above with the use of ad viewability measurement to identify low quality publishers. Let us suppose that 50% is chosen as a target viewability rate. The advertiser would have to buy just 272 impressions across any publisher to be confident of achieving this viewability rate.
By the example numbers, view-through conversion analysis requires 20,000 times more ad impressions to achieve statistical significance than ad viewability measurement. CTR analysis is more efficient but it still requires 1,000 times more ad impressions for statistical significance than ad viewability measurement. Both view-through conversion analysis and CTR analysis require the creative to be fixed. Ad viewability measurement is independent of the creative.
Conclusion
In this article we have seen that advertisers do not have the tools necessary to measure how inventory quality differs between publishers within an exchange. The impressions being bought by advertisers through exchanges are too sparsely distributed across publishers for each advertiser to optimise confidently for view-through conversions or CTR. As advertisers cannot measure inventory quality, they also cannot price inventory appropriately. Taken together, advertisers continue to achieve lower ROI across ad exchanges than they could potentially achieve.
Whilst advertisers cannot improve the ROI they achieve through any exchange, they can measure the aggregate ROI they achieve across any exchange. This means that advertisers will gravitate toward exchanges with a higher average quality of ad inventory.
In this article we have seen that ad viewability measurement provides an efficient and effective way for an exchange to improve the quality of its ad inventory. Ad viewability measurement typically requires 20,000 times fewer ad impressions to identify low quality publishers than view-through conversion rates—and 1,000 times fewer impressions than click-through rates. As a tool for improving inventory quality, ad viewability measurement is independent of the ad creative.
—
Abstract
Advertisers typically only buy a fifth of the display ad inventory available through any ad exchange, and they are currently failing to identify and buy the best quality ad inventory. Ad exchanges can help advertisers find and buy the best unsold ad inventory by filtering out ad inventory from lower quality publishers. By increasing the average return on investment for its advertisers, an ad exchange will attract more spend from competing ad exchanges and from other marketing channels. Ad exchanges can use ad viewability rates to filter out low quality publishers efficiently: ad viewability rates typically require 20,000 times fewer ad impressions to identify low quality publishers than view-through conversion rates—and 1,000 times fewer impressions than click-through rates. As a tool for improving inventory quality, ad viewability measurement is also independent of the ad creative.
† The equation used to determine the statistically significant
number of impressions required to identify a low quality domain is:
(n = {Z_{frac{a}{2}}}^2p^{*}frac{1-p^{*}}{E^2}) , where
(Z_{frac{a}{2}}) is the entry in the Z table with a confidence
interval of (frac{a}{2}). (a) was chosen as 5% for our
calculations, giving a (Z_{frac{a}{2}}) value of 1.65. (p^{∗}) is
the threshold rate. (E) is our allowable error which we set as 10%.
Independent of any questions of granularity, the statistics
required to do effective CTR analysis is not trivial.
// < ![CDATA[
// < ![CDATA[
// < ![CDATA[
// < ![CDATA[
// < ![CDATA[
// < ![CDATA[
//
[mathml_js]
References
[1] comScore. Changing How The World Sees Digital Advertising. 26 March, 2012
[2] Alexei Yavlinsky, Simon Overell, Douglas de Jager. Identifying Deviant Publishers across Display Advertising Exchanges: A Case Study. July 2012.
[3] Kuang-chih Lee, Burkay Orten, Ali Dasdan, Wentong Li. Estimating Conversion Rate in Display Advertising from Past Performance Data. 12 August, 2012
Ad VerificationDisplayExchangeProgrammaticViewability


Follow ExchangeWire