Adform RTB Trend Report Europe Q3 2013
by Romany Reagan on 2nd Dec 2013 in News

The European programmatic market continued to show signs of growth, health and market stabilisation in the third quarter of 2013. RTB ad spend increased by 31%, and CPMs saw a modest 3% gain. While third-quarter growth was less dramatic than the first half of 2013, it’s important to remember that many Europeans were on summer holiday, and online advertising traditionally declines in July. By September 2013, programmatic buying continued its upward climb, and we believe the true RTB bellwether will be the upcoming holiday shopping season.
Another good sign for programmatic buying is the proliferation of private marketplaces used by premium publishers and advertisers to trade exclusive inventory. The private marketplaces will continue to increase both spend and yields in the months to come.
The average click-through rate (CTR) mirrored the summer holidays, reaching its lowest point in July, and then climbing back up to the rates last seen in January 2013. In our last quarterly report, we predicted a long-term decline in CTRs due to an influx of brand campaigns, which are optimised for metrics other than the CTR. Indeed, the first half of the year saw declines across Europe. While we still believe this to be the case, we anticipate a fourth-quarter rise in CTRs as a result of holiday promotions and numerous retargeting campaigns.
CTRs for above-the-fold and below-the-fold inventory grew at approximately the same rates, though their CPMs were more disparate (prices for below-the-fold inventory increased at nearly twice the rate as those above). At the same time, the cost-per-click (CPC) rate for above-the-fold impressions decreased by 4%, while those below stayed roughly the same. Below-the-fold inventory continues to deliver the highest CPC, and advertisers who are seeking to optimise their campaigns on the metric are wise to focus on inventory that’s above-the-fold.
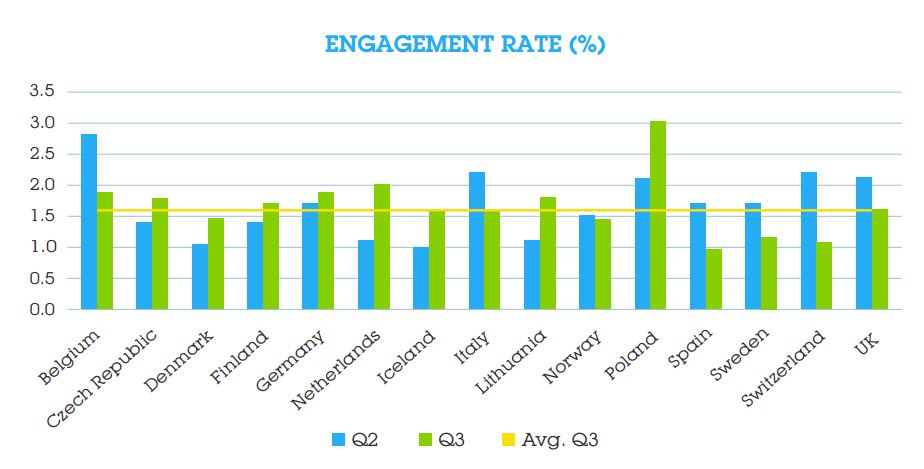
The average engagement rate in Europe grew at a healthy rate (7%), which is good news for brand marketers. Part of that growth can be attributed to the accelerated adoption of Rich Media formats, which do a better job at engaging consumers. We expect engagement rates to increase in the quarters to come due to a suite of newly available Rich Media formats that entered the RTB market in November 2013.
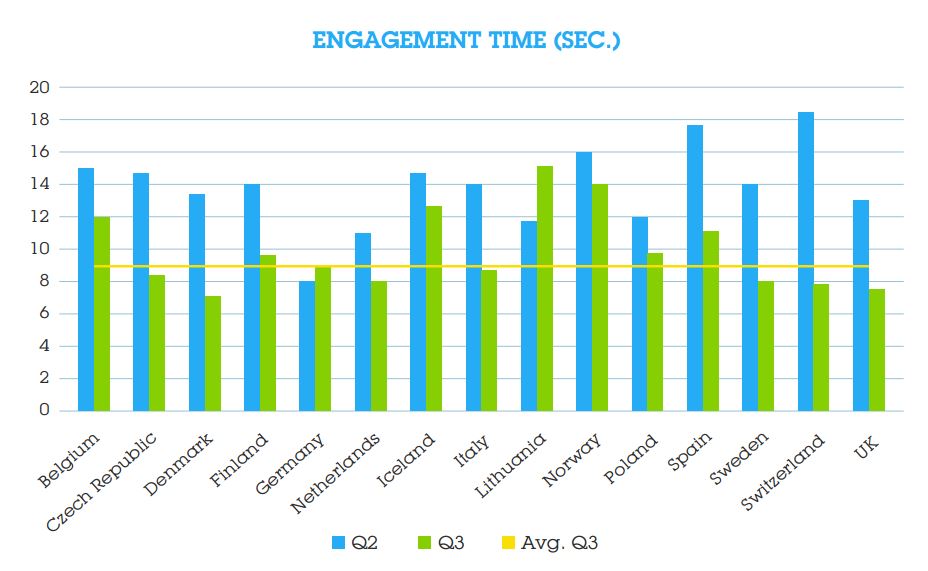
Engagement time decreased from 12 seconds in Q2 to 9 seconds in Q3. This decline may be a result of summer shopping retargeting campaigns that rely on images rather than video.
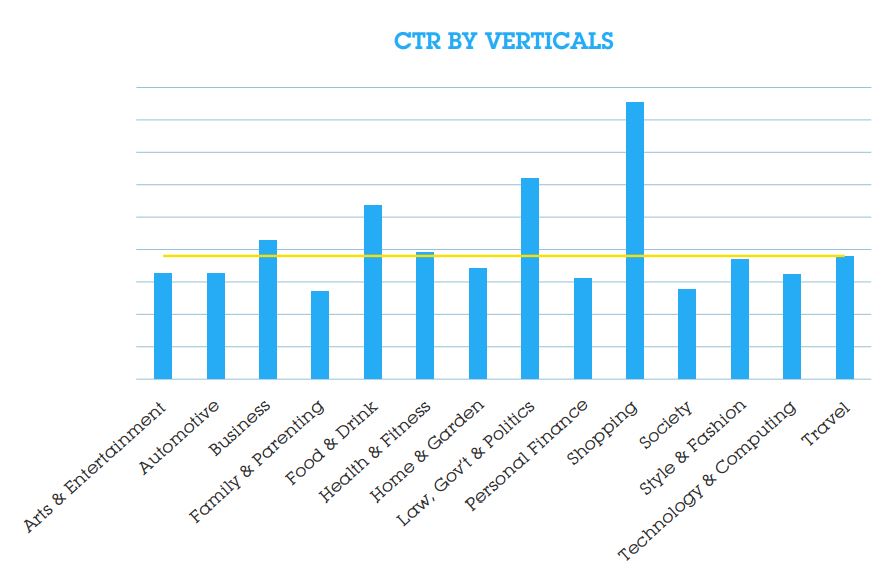
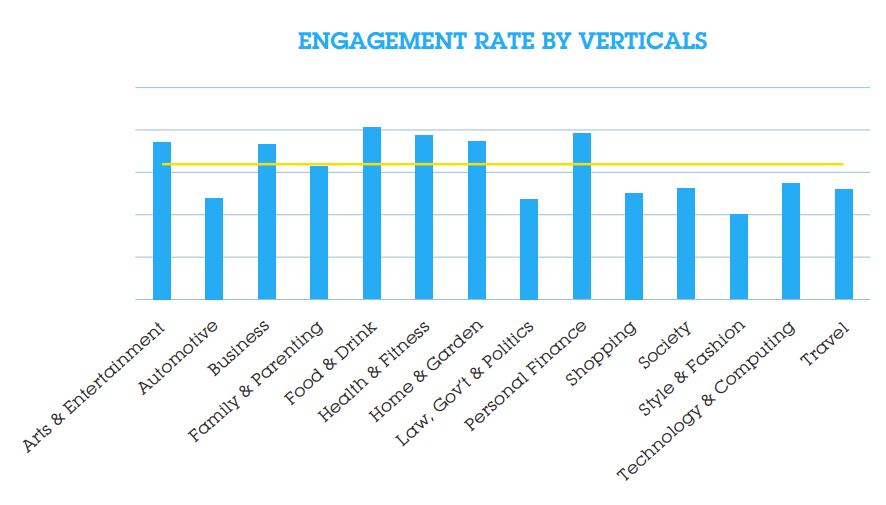
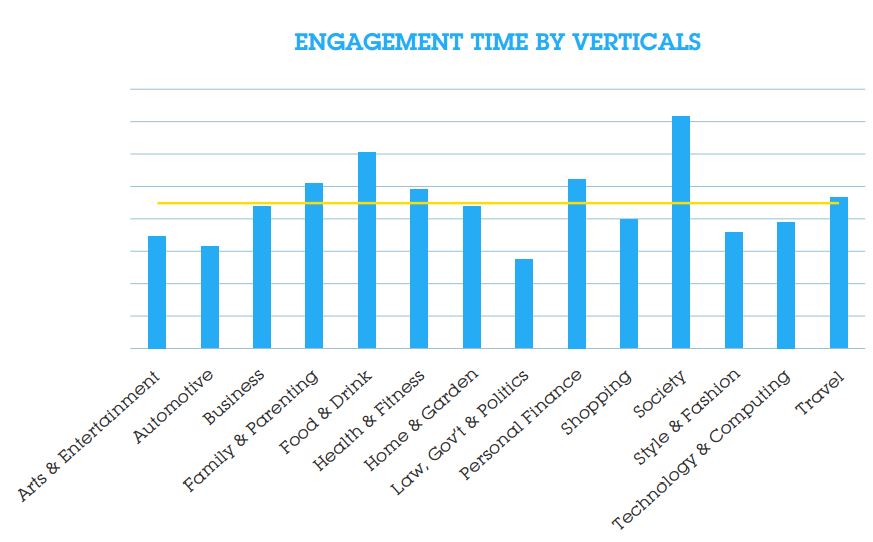
In terms of performance by industry sector, Shopping earned the highest CTRs, no doubt aided by numerous retargeting campaigns and technology that match the right ad with the right user. Food & Drinks was the third best performer, perhaps due to the highly creative and eye-catching banners used by the vertical, particularly by wine and spirits companies. Engagement rates across the remaining sectors varied far less, with Food & Drinks, Health & Fitness, and Personal Finance engaging users most frequently. As for engagement time, the Society category held users’ attention the longest.
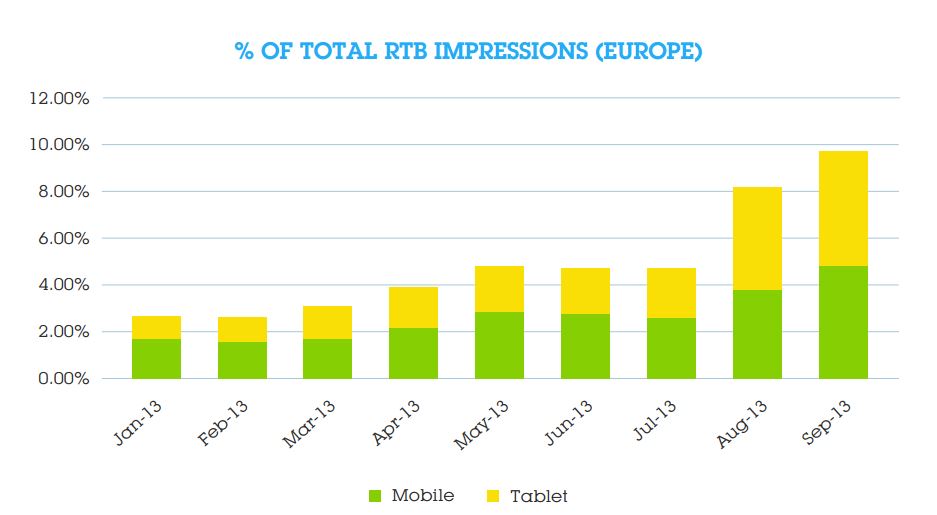
Mobile is the real story in the third quarter. Mobile RTB impressions grew by 43%, and tablet impressions by an astonishing 102%. Mobile and tablet inventory now account for 8% of all RTB impressions sold (up from 4% in Q2). While this growth rate is impressive, it is still far below actual mobile usage. Over time, we expect to see an influx of mobile and tablet impressions in the RTB market.
Finally, in terms of CTR, Saturday and Sunday continue to offer the best value for advertisers. Users are 17% more likely to click a banner during the weekend, though CPMs are half of what they are during the week. We also delved into response rates and CPMs by hour, and found that most CTRs occur between 4 AM and 7 PM local time, though peak CTR occurs at 2 AM. The number of requests for RTB ads is at its lowest at 2 AM, making it a prime opportunity for marketers to target consumers who have trouble sleeping.
General Trends in RTB
General Growth in Spend
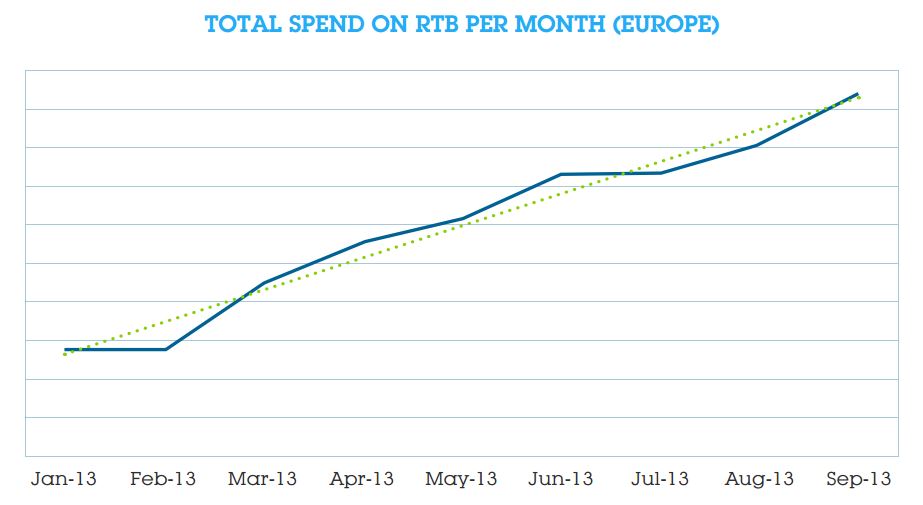
Spend for programmatic inventory continues to grow at a healthy clip. This quarter, we saw a 31% boost in spend across the continent, significantly less than the previous two quarters of 2013, to be sure, but not alarming given the traditional July-August lull in online advertising. The month of September saw accelerated growth in spending – a trend we believe will be sustained through the end of the fourth quarter.
Average CPM Increases
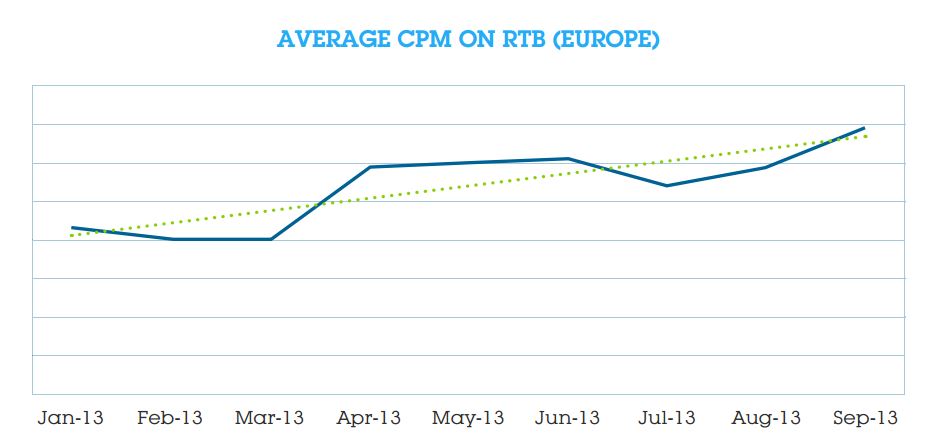
The CPMs paid for RTB media grew by a modest 3%; a sign that the buying model is entering a phase of stable growth, experiencing just slight peaks and valleys. The good news, however, is that the rise in CPMs is holding steady. Higher yields serve as an inducement for publishers to participate in the RTB market.
Average CTR increases
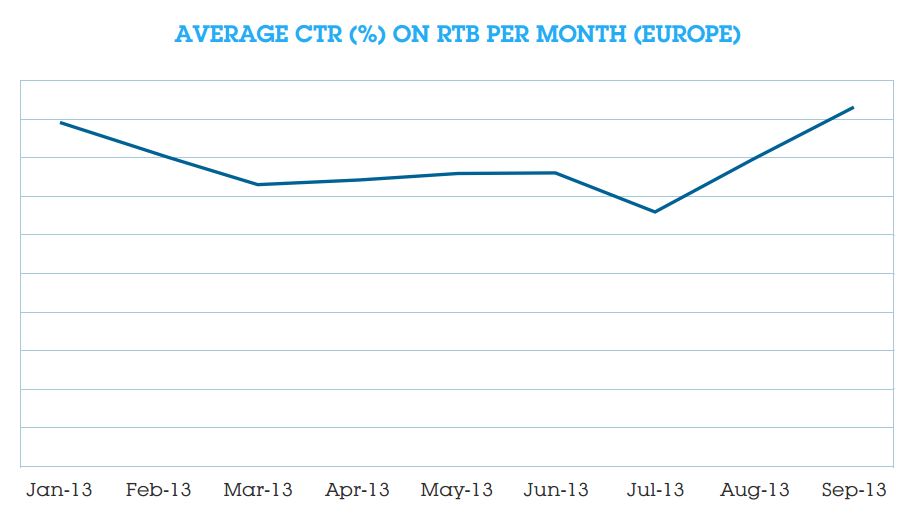
European CTRs mirrored the summer holidays, reaching its lowest point in July before climbing back up to January 2013 rates. On the whole, CTR in Europe is remarkably stable, enabling marketers to design campaigns around anticipated returns.
Performance/Branding
RTB Performance by Country
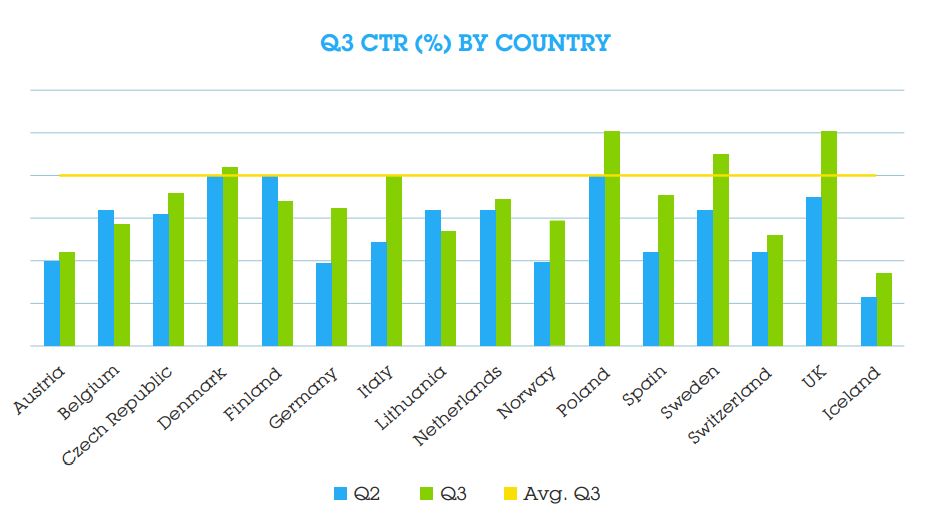
European CTRs rebounded in Q3, after sharp declines in the first half of the year. The increased clicks may be the result of an abundance of retargeting campaigns. In general, CTRs are showing signs of stabilisation.
This quarter delivered very good news for brand marketers: the average engagement rate in Europe grew at an impressive 7%, a clear indication that their Rich Media formats and brand messages go a long way towards raising brand awareness. We expect engagement rates to increase substantially in the coming quarters due to newly available Rich Media formats that entered the RTB market in October 2013.
Engagement time decreased from 12 seconds in Q2 to 9 seconds in Q3. The decline may be the result of a preponderance of retargeting and performance campaigns using banner ads with static creatives in lieu of video.
Performance by Industry Verticals
Looking at performance by verticals, the shopping category by far earns the highest CTR%, possibly as a result of numerous RTB-executed retargeting campaigns.
Food & Drinks was the third top performer, a category that encompasses wine and spirits companies. These companies tend to launch campaigns with a strong social media component, which may explain the high CTR.
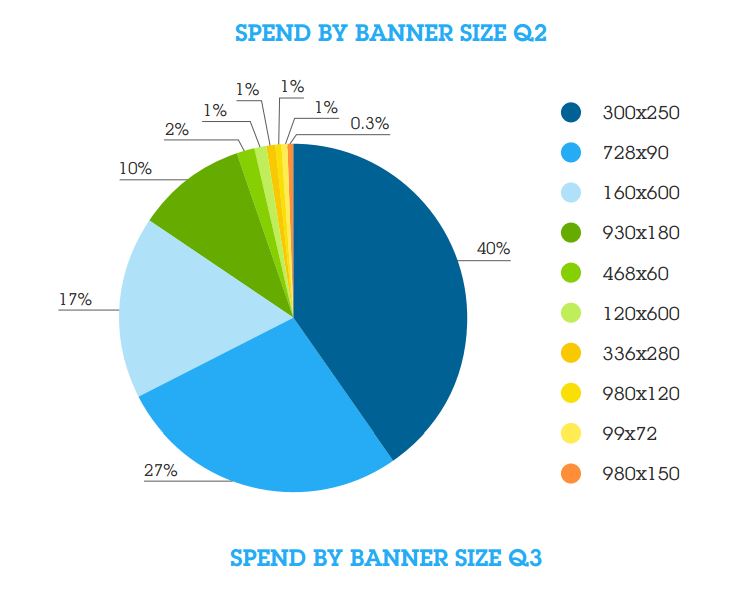
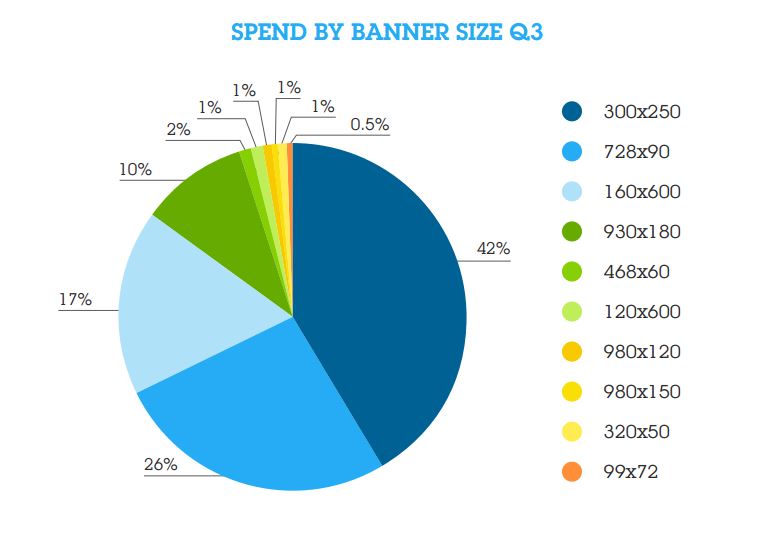
Banner Formats
The top three most popular banners continue to dominate the marketer’s budget in Q3, accounting for 85% of total RTB ad spend. This comes as no surprise since these banner formats offer an appealing combination of premium prices and CTR, making them reliable ad units for both buyers and sellers.
The most popular banner is still the rectangular 320x250 (article), which saw a 2% spend increase in Q3. Given the massive volume of units traded, a 2% bump is significant. A possible reason may be that 320x250 is now used for mobile ads as well as display (mobile buying increased significantly as we report in the next sections).
The second next popular banner is still the 728x90 (top banner), though spending for it decreased by 1%, which is also sizable given the number of units traded. The third most popular banner, 160x600 (skyscraper) saw no change in spending levels.
The attention-grabbing 930x180 (mega-format) banner still earned just 1% of the total spend, though it continues to earn the highest CTR and CPMs.
A note-worthy development is the appearance of a banner format designed specifically for mobile (320x50), which earned 1% of ad spend, bumping the 336x280 format (primarily used by Google AdSense) off the list of top banners.
Once again, the 99x72 banner (Facebook ad) continued to earn 1% of RTB ad spend.
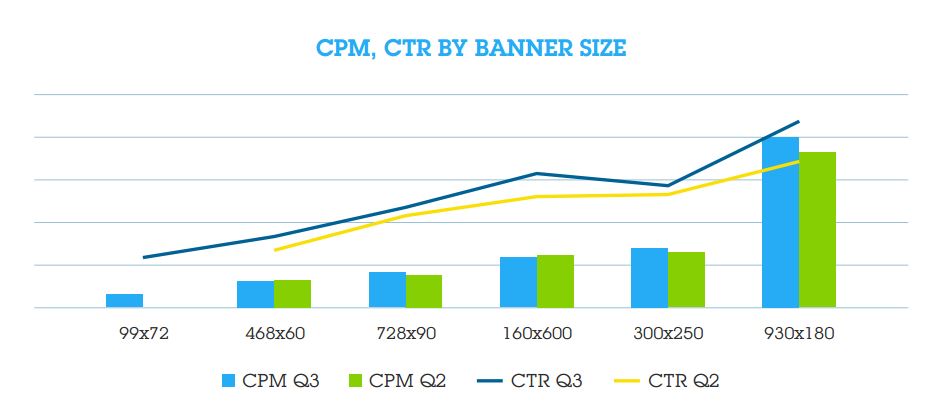
Comparing CPM and CTR by banner size, the most striking observation is the extent to which the RTB marketing is stabilising. We see small fluctuations in price, not the peaks and valleys that characterise new markets. The exception is the 930x180 mega banner, which saw a 9% increase in CPMs.
Mobile Devices
Mobile impressions are becoming more abundant in the RTB markets, growing by 43% from Q2 to Q3, while tablet impressions grew by an astonishing 102%.
Combined, these impressions represented 8% of all RTB impressions – up from 4% in Q2. The 100% growth in mobile and tablet impressions is good news for advertisers seeking to engage consumers where they spend the most time: on their mobile devices.
Still, even with 100% growth, mobile and tablet advertising lags far behind consumer adoption and usage. In some regions within Europe, mobile represents 50% of all traffic.
Time
By Week Day
Adform first reported on this critical trend in the Q2 2013 report; this quarter we dug deeper into the trends.
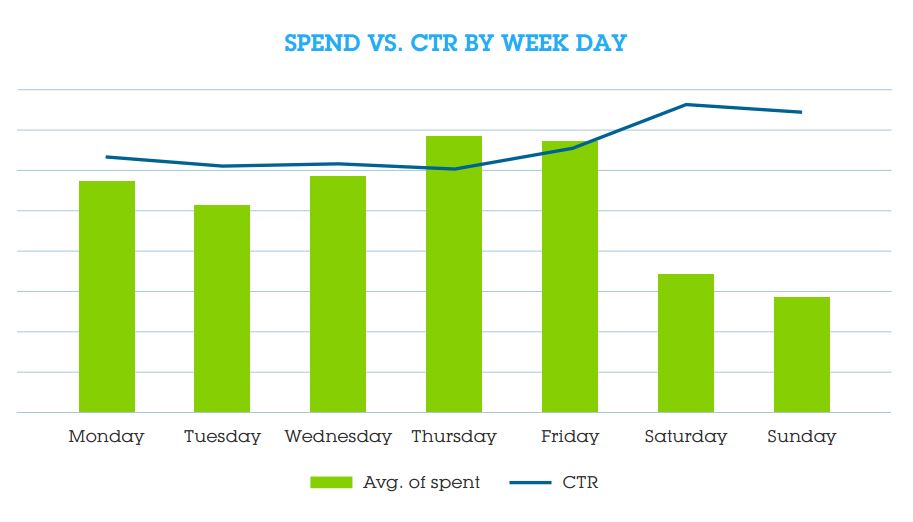
Spend in the RTB markets drop at the weekend, though CTRs are at their all-time highest for the week. At the same time, CPMs for weekend inventory dropped by 50%.
Given that this trend has remained consistent in Q3, we can conclude that advertisers should consider allocating a greater portion of the ad spend to the weekend.

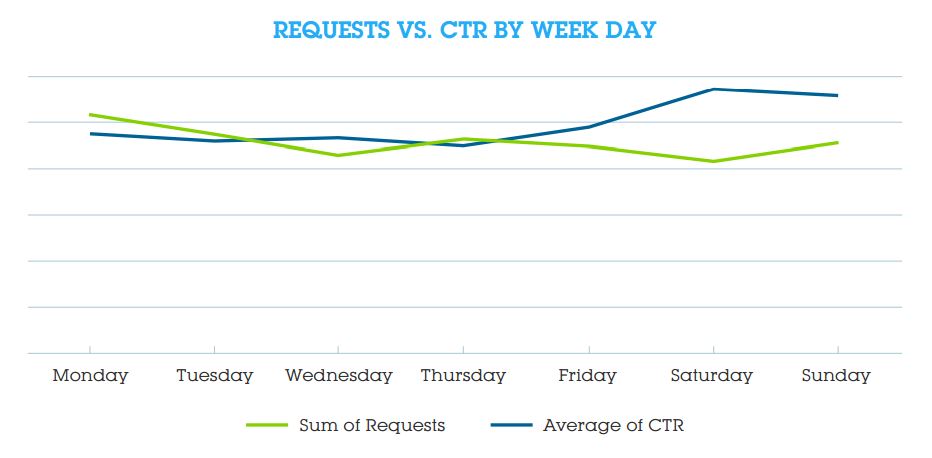
Requests vs CTR
Looking deeper into this phenomenon, we compared CTRs to requests (i.e. the number of times a publisher sends a request for an ad to retail market) by weekday. We’ve found that the number of requests begins to decline on Thursdays – at almost the exact same time that CTRs begin their climb up. Saturday mornings see the widest gaps between requests for ads and CTR.
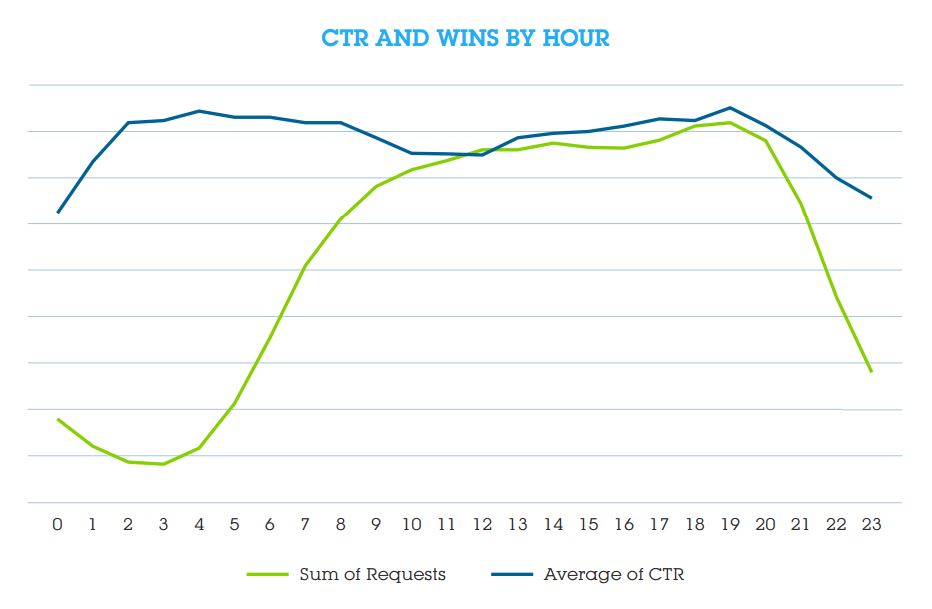
Requests vs CTR by hour
The highest CTRs occur between 4 AM and 7 PM local time, though peak CTR occurs at 2 AM. Insomnia may explain the high CTR in the early morning hours (poor sleepers may rely on the internet to pass the time). Likewise, low CTRs from 11 PM to 12 PM may be a result of most people attempting to concentrate on sleep. CTRs remain steady during work hours, when people have near-constant access to computers and the internet.
The number of requests peaks from 9 AM to 7 PM, which mirrors the work day, then experiences a 4x plunge from 8 PM to through midnight.
Both CTRs and requests drop around 7 PM, which may be the result of consumers concentrating on family time (dinner, homework, watching television, meeting friends, etc.). They also concentrate on other devices (mobile and tablet) as well as social media sites.
Once again, we see a huge disparity between CTRs and requests in the hours between 1 AM and 3 AM.
The full Adform RTB Trend Report Europe Q3 2013 can be downloaded here.
AdvertiserBrandingCreativeDisplayMobileProgrammatic


Follow ExchangeWire