Programmatic Growth in Europe in 2015; Ad Blocking Will Cause Loss of USD$32bn in 2019
by Sonja Kroll on 26th May 2016 in News

ExchangeWire Research’s weekly roundup brings you up-to-date research findings from around the world, with additional insight provided by Rebecca Muir, head of research and analysis, ExchangeWire. In this week’s edition: Programmatic grew over 100% in Europe in 2015; Double-digit billions in monetary losses due to ad blocking; Apps generate more revenue than mobile web; and Cross-channel analytics on the rise.
Triple-digit growth for programmatic in Europe
Looking back at 2015, programmatic trading in Europe experienced triple-digit growth over the last year, a study by Adform finds. The RTB Trend Report Europe 2015 identified slower growth for programmatic advertising than the previous year; but spend nonetheless increased by 121.35% across Europe in 2015.
All across Europe, programmatic ad spend is on the rise, experiencing double-digit increases in most markets. Particular growth markets were Slovenia, with a 272% increase in ad spend, closely followed by Austria (224%), and Slovakia, with 184%.
“It’s gratifying to see the sustained growth in programmatic marketing and the positive benefits for both publishers and advertisers”, comments Martin Stockfleth Larsen, CMO, Adform. “Our report clearly demonstrates that publishers who offer premium inventory via private marketplaces and rich media brand formats are rewarded with better yields.”
Overall CPM average increased by 99.15% between January and December 2015, with the majority of the growth (73%) occurring during back-to-school and holiday shopping seasons.
Interestingly, CPMs grew particularly strong on desktop (111%), followed by smartphone (57%), and tablet (28%). CPMs in private marketplaces were 21.6% higher than those of open auctions.
Similarly, higher CTRs were delivered via PMPs than in open auction. CTRs on PMPs were 42.1% higher than in open auctions.
USD$32bn ad spend losses due to ad blocking projected by 2019
The amount of ad spend at risk due to ad blocking is set to double over the course of the coming three years. That is the result of a study conducted by Optimal in collaboration with Wells Fargo Securities. Based on a survey of US smartphone users, the study asked users about their ad-blocking preferences and produced a forecast of how much ad revenue is at risk due to ad blocking.
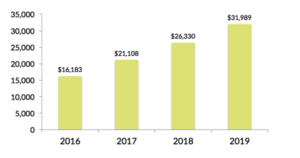
According to the projection, advertisers will lose a total revenue of USD$16.2bn (£11bn)in 2016. The amount of ad spend lost will increase by approximately USD$5bn (£3.4bn) every subsequent year, culminating in an ad spend loss of USD$31,98 (£21.76bn) in 2019, mainly driven in the US by developments in ad-blocking technology, FTC action on deceptive ads, and legislative action by US government authorities on mobile ad data use.
Commenting on the findings, Kiosked-founder and CCO Antti Pasila said: “Publishers often put monetisation at the expense of the user, which leads them to installing ad blockers for a better viewing experience. Publishers need to put user experience ahead of quick monetisation wins. Two key aspects of a successful ad impression include the ad actually getting seen by a user and being relevant, either contextually or behaviourally. Using a transparent platform, and positioning ads in key places, publishers will create a much better overall user experience and go some way to making ad blockers defunct.”
Apps generate 13-times more revenue than mobile web
In their quarterly mobile marketing report, Opera Mediaworks analyse data from the top 100 apps that use Opera Mediaworks to monetise their traffic. According to their Mobile First Insights report, mobile users are spending an average of 30 minutes each day in each of these popular apps. The average session length is over eight minutes, leading Opera Mediaworks to conclude that audiences are committed to, and engaged in, these apps' content – unlike other forms of media from which the user’s attention is quickly diverted.
Analysing the top categories by impression, Opera Mediaworks took a look at their US market in March 2016. The category with the most impressions is Games, followed by News & Information, and Social Networking.
In terms of conversions, Lifestyle, Games, and Education are the categories that record the highest number of conversions. Interestingly, a comparison of the value of apps versus mobile web, on Opera Mediaworks’ mobile ad platform, shows that the number of impressions served on mobile apps versus mobile web are similar. However, the CTR for apps is more than twice than mobile web CTRs, which has a clear impact on the revenue generated from advertising: apps generate a whopping 13-times more revenue than mobile web.
A quarter of UK marketers still use outdated last-touch attribution
Cross-channel measurement and analytics are on the rise. Although 23% of marketers in the UK are still using outdated last-touch attribution, 26% are already using statistical modeling and algorithms to measure performance. According to Conversionlogic’s study, the vast majority of marketers (78%) are planning to switch to cross-channel attribution methods within the next two years.
“While the need for cross-channel attribution has long been widely contemplated, and much of the field was plowed by first-generation providers, attribution must be an integral part of a marketer’s technology stack and integrated with all data sources”, said Alison Lohse, COO and co-founder of, Conversion Logic.
 Almost two-thirds of marketers questioned for the survey said that data collection and centralisation prove their biggest challenge, while half have concerns about accuracy. Other reasons that have held marketers back from introducing cross-channel attribution are the costs involved (70%), lack of appropriate skills within their marketing teams (56%), and problems with integration with existing measurement methods (48%).
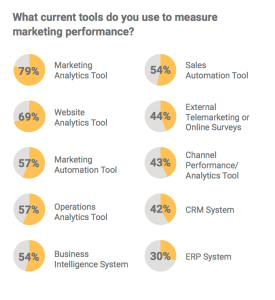
Currently, most marketers use an average of six measurement tools. Most widely used are marketing analytics tools (79%), website analytics tools (69%) and marketing automation tools, as well as operations analytics tools (57% each).
Ad BlockingAdvertiserAgencyattributionDataDigital MarketingEMEAExchangeWire ResearchMartechMeasurementMedia SpendMobilePMPProgrammaticPublisherUKViewability


Follow ExchangeWire