Mobile Web Header Bidding Impressions Grew 285% YOY
by Lindsay Rowntree on 16th Aug 2017 in News

In association with PubMatic
Yesterday (15 August), PubMatic released its second Quarterly Mobile Index (QMI) report of 2017, providing insight into the mobile advertising industry for both publishers and advertisers in Q2 2017. The main highlight from the report was that header bidding in mobile channels is thriving, both in terms of monetised impression volume growth and mobile web header bidding eCPMs.
Six key trends were identified in the report, through analysis of the flow of digital impressions through PubMatic’s platform, SEVEN. As well as the healthy growth of mobile header bidding, the report identified an uptake in emerging mobile programmatic formats, including video and native; growth in monetised mobile PMP impression volume and eCPMs; an increase in mobile app impression volume; the continued dominance of Android as the driver of mobile app opportunity; and worldwide growth of mobile opportunities, particularly in EMEA.
1. Header bidding’s monetised impression volume grew at more than twice the rate of desktop YOY in Q2
PubMatic found that monetised header bidding impressions through the SEVEN platform overall rose 149% in the second quarter versus the previous year. Furthermore, in May 2017, over 80% of global publishers’ impressions processed used header bidding technology.
While desktop retained a dominant share of impressions, mobile volume increased 285% year-on-year, more than double the 130% increase seen across desktop. According to the report, the growth rate gap between desktop and mobile was the narrowest on record, signalling that mobile header bidding has moved beyond the early-adoption stage, into the mainstream. The rise of mobile header bidding is unsurprising, given the success it has seen across desktop, coupled with the fact that consumers are going increasingly mobile. “Mobile advertising has really come to the forefront because that’s where consumer eyeballs are”, confirmed Osbaldo Franco, director of marketing research at PubMatic.
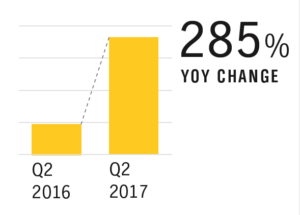
Monetised Mobile Web Header Bidding Impression Volume
Across verticals, news publishers saw the largest uptake, with mobile header bidding inventory representing nearly one-fifth of the total, up from 12% in the same period last year.
Regionally, APAC’s share of mobile web header bidding impressions doubled, representing 4% of global monetised impressions, with the Americas and EMEA each experiencing significant growth of over 250% year-on-year.
It was also good news for eCPMs, rising almost 150%, versus the same period last year, to a level almost equal to desktop.
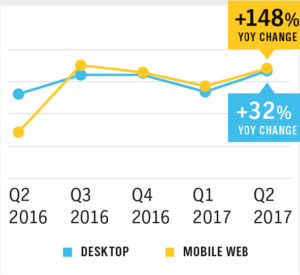
Monetised Header Bidding Impression Volume & Platform Share
“Header bidding has given publishers a more holistic view into the value of their inventory, which is an important step as more publishers continue to embrace a solution that gives them more control”, said Jeff Hirsch, CMO and head of US publisher development at PubMatic. “As mobile matures, solutions like PubMatic’s OpenWrap will make it easier for publishers to optimise mobile web, video, and native.”
2. Emerging programmatic formats, including video and native, are starting to take hold
Mobile devices represented 67% of monetised native impressions across the PubMatic platform in Q2 2017. Seventy-five percent of this occurred on the mobile web. With a focus on improving consumer engagement, it is expected that mobile native will continue its growth trajectory, as native formats increase in popularity. Despite the fragmentation in the native space, mobile is expected to maintain a stronghold of native ad delivery, as monetisation opportunities continue to grow.
It’s a similarly positive story for video, as nearly one-fifth of monetised impressions across video ad formats occurred on mobile. Thirty-two percent of this was within mobile app environments, representing a higher proportion versus mobile web, than in the native space.
Video eCPMs remain high, with a 28% premium paid for mobile web video impressions over app.
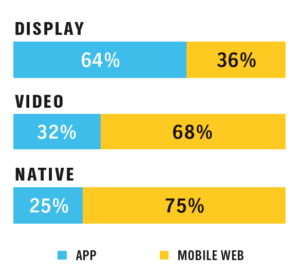
Share of Monetised Mobile Impressions by Platform, Q2 2017
3. Mobile PMP impressions & eCPMs both up YOY
Monetised mobile PMP impression volume was five-times higher than in Q2 2015 and saw its sixth consecutive quarterly increase, up 73% from the same period last year. Mobile PMP eCPMs have seen similar growth patterns, up 23% year-on-year; nearly double the overall growth rate of mobile eCPMs, resulting in a 1.5x premium through mobile PMP versus mobile overall.
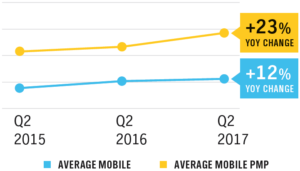
Average eCPMs, Mobile PMP vs Total Mobile
The trend for mobile PMPs shows little sign of slowing down, driven by a greater demand for control and transparency. As the report confirms, publishers looking to regain control over their digital assets, along with advertisers seeking brand-safe, quality inventory will find benefit in PMPs.
4. Mobile app impression volume more than doubles
In line with consumer trends of mobile app usage, the volume of mobile app impressions transacted through SEVEN more than doubled, growing 107% YOY in Q2 2017. During the same period, the volume of mobile web impressions declines 35%. This growth in mobile app impressions has meant that its share of total mobile impressions has almost doubled in the space of a year, rising from 38% to 66% of total mobile impressions.
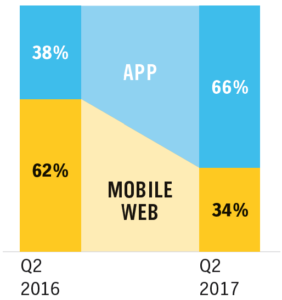
Share of Monetised Mobile Impressions by Platform
Despite this growth in volume, mobile web eCPMs still reign supreme, having experienced a 71% year-on-year growth, with the Americas specifically seeing a 92% growth, versus the same period in 2016.
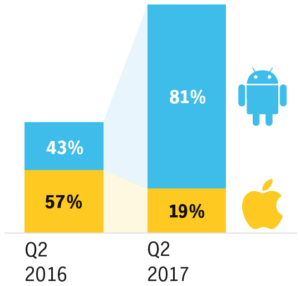
5. 81% of app impressions were served to Android-powered devices
Android-powered devices took 81% market share by operating system of mobile impression volume in Q2 2017, with impression volume increasing 285%. Much of this has been driven in EMEA, which saw Android mobile impressions increase twelve times year-on-year, giving EMEA a 40% share of all monetised Android impressions globally – almost quadruple its percentage share during the same period in 2016.
However, while Android produced the highest eCPMs in Q4 2016, iOS has once again taken the top spot, with 27% higher eCPMs – up from 23% in Q2 2016.
Share of Monetised Mobile App Impressions, by OS
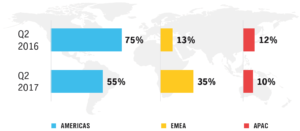
6. EMEA’s share of mobile impressions nearly tripled YOY
Despite strong growth in mobile monetisation globally in Q2 2017, EMEA once again recorded the greatest level of growth, with its global share of monetised mobile impressions jumping from 13% to 35%. This resulted in both the Americas and APAC seeing a drop in their overall share, at 55% (down from 75% in Q2 2016) and 10% (down from 12%) respectively.
Share of Monetised Mobile Impressions, by Region
It’s a mixed story for mobile eCPMs, which saw an 11% increase globally. EMEA and the Americas both experienced significant growth, at 141% and 60% respectively, yet APAC saw a 5% drop. According to the report, this minimal decline was largely attributed to a double-digit drop in mobile app eCPMs, combined with an increase in mobile web eCPMs, resulted in the two changes almost cancelling each other out.
The latest Quarterly Mobile Index report, issued quarterly by PubMatic, is available to download now.


Follow ExchangeWire