Mobile Device Hijacking Costs Advertisers $857m; 333% Increase in Rich Media Ad Spend
by on 30th Jul 2015 in News

ExchangeWire Research’s weekly roundup brings you up-to-date research findings from around the world, with additional insight provided by Rebecca Muir, ExchangeWire, head of research and analysis. In this week’s edition: Mobile device hijacking costs advertisers $857m; 333% increase in rich media ad spend; mobile apps account for majority of traffic; and Instagram global revenue reaches $595m.
Fraudsters strike again
Global revenue lost as a result of in-app fraud will surpass $1bn in 2015, according to research by Forensiq. Forensiq uncovered a new type of ad fraud called ‘mobile device hijacking’, where mobile applications rapidly load hidden ads and emulate human behaviour. Mobile device hijacking affects 12 million devices globally, and 13% of in-app pre-bid advertising inventory.
Android has the highest in-app fraud rate (14.8%), followed by iOS (11.7%), and Windows (8.8%). The cost of mobile device hijacking to advertisers is estimated to be $857m per year. Only 10-20% of the ads displayed by fraudulent apps are viewable, with malicious apps opening 20 ads per minute when hidden. For consumers, mobile device hijacking can cause a device to waste 2GB of data per day.
Triple-digit growth of rich media programmatic trading
European programmatic ad spend has risen by 76% year-over-year, driven by a 333% spend increase on rich media, according to Adform’s ‘RTB Trend Report Europe Q1 2015’. Viewability in Europe is just 55%, down 0.7% compared to Q1 2014. Engagement rates fell by 33%, with consumer engagement time falling from 13.9 seconds to 12.7 seconds.
The majority of ad spend (75.5%) goes on desktop formats, down from 77.2% last year. Mobile accounted for 12.2% of ad spend, up from 8.8% in Q1 2014. The amount of inventory traded programmatically increased 76% year-on-year, meanwhile, the average CPMs increased by 42%. Cost per click (CPC) in private marketplaces is 31% higher than in open auctions. Martin Stockfleth Larsen, CMO Adform commented: "Both advertisers and publishers are embracing the advances of the industry ... executing increasingly sophisticated campaigns that drive excellent results."
Apps account for majority of mobile traffic
Globally, mobile apps receive the majority of traffic (55.9%) and ad revenue (70.9%), according to Opera Mediaworks ‘State of Mobile Advertising’. Africa and the Middle East buck this trend, with web impressions accounting for 95% and 70% of traffic respectively. This can be attributed to the broadband infrastructure and smartphone penetration within these markets, as cited in The Mobile Africa 2015 study. 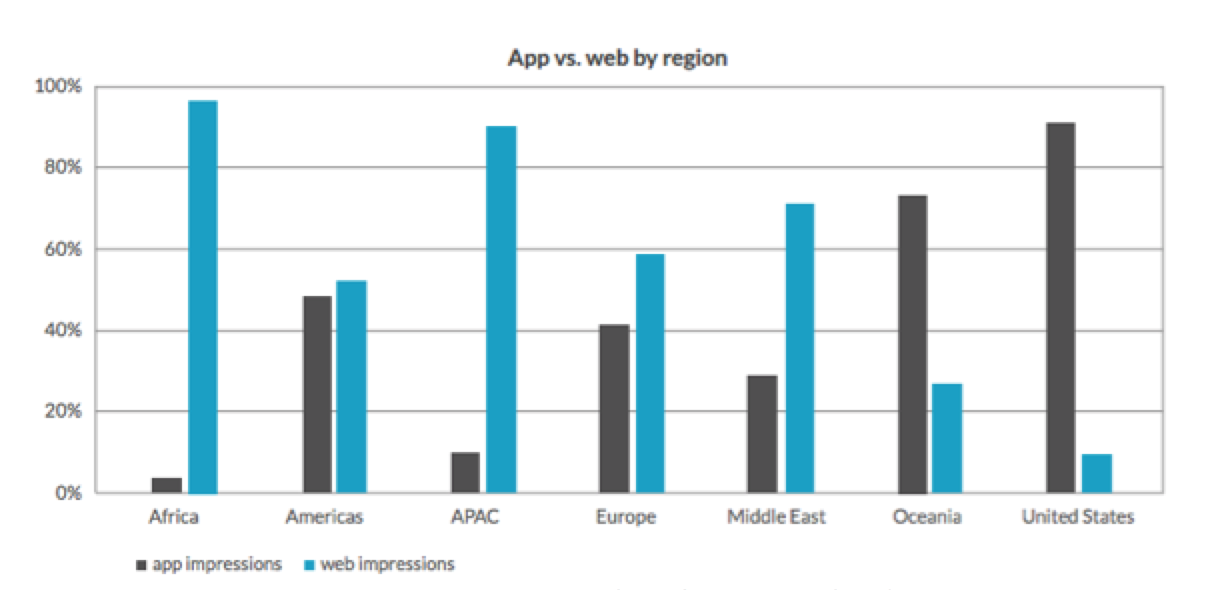
Android remains top when it comes to traffic with 63.7% market share, compared to iOS with 22%. However, when it comes to revenue, Android only surpasses iOS with 47.7%, versus 47.2%. iOS outperforms Android in video advertising performance with the majority of impressions (56.6% versus 42.8%) and a superior completion rate (87.2 versus 76.7%).
Instagram set to overtake Google & Twitter
In the US, Instagram’s mobile display ad revenue is set to surpass Google and Twitter by 2017, according to eMarketer’s ‘Instagram ad spend forecast’. Instagram’s global ad revenues are projected to reach $595m this year, driven by high consumer demand, and the introduction of new ad products. Instagram’s global mobile ad revenue is projected to reach $2.81bn in 2017, accounting for 10% of Facebook’s global ad revenue.
Yesterday, ExchangeWire reported less than brilliant quarterly results for Twitter, highlighting lack of user growth as a challenge that must be overcome in order for Twitter to compete with Facebook and Instagram.
Ad FraudCreativeFacebookMobileNorth AmericaProgrammaticViewability


Follow ExchangeWire