European Digital Ad Spend Surpasses TV; 57% Ads In-View in Q1 2016
by Sonja Kroll on 12th May 2016 in News

ExchangeWire Research’s weekly roundup brings you up-to-date research findings from around the world, with additional insight provided by Rebecca Muir, head of research and analysis, ExchangeWire. In this week’s edition: Digital ad spend grew by 13.1% in 2015; Improvement in quality of online advertising; Mobile to dominate UK e-commerce; UK average CPM second-highest in Europe.
Record Spend for European Digital Advertising in 2015
European online advertising has finally surpassed TV ad spend. According to the IAB’s AdEx Benchmark 2015, online advertising in Europe grew 13.1% in 2015. With a total ad spend of €36.2bn (£28.6bn) it has surpassed the €33.3bn (£26.5bn) European TV ad spend in 2015. “These results confirm the lead position for digital advertising in the European media landscape echoing today’s digital-first consumer environment”, says Townsend Feehan, CEO, IAB Europe.
In Europe, display advertising showed a growth rate of 17.4%, resulting in a total value of €13.9bn (£11bn) for the display market. Mobile takes about a quarter of the display market (25.4%), resulting in ad spend of €3.5bn (£2.8bn), and showing a stunning growth rate of 60.5% year-on-year.
Despite slower growth, search remains the largest online advertising format, with a growth rate of 12.6% to a market value of €16.9bn (£13.4bn).
The IAB found that the UK has the highest ad spend in Europe, with €11.8bn (£9.3bn), followed by Germany at €5.8bn (£4.6bn), and France at €4.2bn (£3.2bn). The three growth markets were Ireland with 29.0% growth, Bulgaria at 22.3% growth, and Poland with 21.8% growth in 2015.
“In a challenging economic environment and flat media market, online advertising has been the shining star, keeping the European advertising market afloat, and again in 2015 lifting it out of decline”, summarises Eleni Marouli, principal analyst at IHS Technology and author of the report. “Mature and emerging markets alike have noted strong growth rates again this year, demonstrating that innovation in formats, data, and targeting continues to attract performance and brand budgets online.”
Quality of digital advertising is improving
Good news with regards to viewability: media quality in the first quarter of 2016 has improved year-on-year, with less ad fraud and more ads in view, Integral Ad Science’s Media Quality Report finds. Analysing data that comprised billions of ad impressions, the report concludes that 57% of ads were in-view. Only 5% of ads were fraudulent, and brand risk was at 7%.
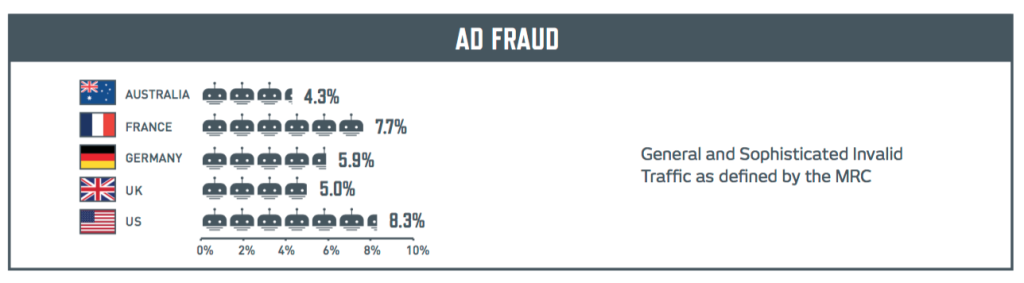
Comparing viewability, ad fraud, and brand-risk levels internationally, the report finds the UK viewability rate at second place behind France (60.9%) and ahead of Germany (53.7%). Viewability in the US was identified as 52%. Ad fraud levels are highest in the US at 8.3%, followed by France (7.7%), and Germany (5.9%). Brand risk rates were highest in Germany at 9.9%, with the UK and France following at 7.0% and 6.9% respectively.
Introducing an interesting new metric, Integral Ad Science also took a look at 'ad clutter'. The new metric reflects whether the environment where ads are shown is highly cluttered with six or more ads on a web page. According to preliminary results, ad clutter in the UK is “under control”, with only 3.2% of impressions served on cluttered pages. France and Germany had lower ad clutter levels at 2.0% in France and 2.4% in Germany.
Half of UK e-commerce transacted on mobile devices
Mobile continues to transform the retail environment in the UK. According to a Criteo study conducted by Ovum, almost half (48.9%) of all e-commerce transactions in the UK were conducted on mobile devices, representing a year-on-year increase of 6%. This should provide challenges and chances for the martech community.
“With mobile now accounting for almost half of all e-commerce transactions in the UK, the successful retailers will be those who can target people, rather than devices, delivering tailored and personal shopping experiences that span digital and in-store”, says on Buss, managing director, Northern Europe, Criteo. The most-used device is now the iPhone, with 19% of all transactions handled by Apple’s smartphone; 39% of UK e-commerce transactions involved several devices.
Criteo predicts that mobile will become the driving force of advertising, with mobile becoming the dominant channel, because the mobile web has proven convenient and scalable. From mobile internet advertising revenues of USD$29.77bn (£20.6bn) globally in 2015, Criteo forecasts strong increases to USD$37.89 (£26.3bn) in 2016, reaching more than double the 2015 figure in 2019, at USD$63.94bn (£44.3bn).
Apps continue to be the engines of mobile commerce, representing 65% of transactions on mobile devices globally, with the remaining 35% taking place on the mobile web. “As retail becomes ever more mobile-centric, the range and depth of customer data insights will continue to grow, enabling a richer, contextual view of consumers that will provide retailers with new business models and ways to engage”, comments Eden Zoller, principal analyst, Ovum. “As retailers prepare for the road to 2026, they will need to create ever more persuasive, interactive, personal brand experiences.”
Average CPM in UK at USD$13.50
Based on their own data, StickyADS discloses stats that give insight into publisher preferences in the multiscreen video ecosystem. The quarterly trends reveal that publishers preferred deal ID transactions, resulting in 43% of StickyADS’ revenue generated through this method.
Demand for multiscreen video inventory increased significantly, the report finds: connected TV and mobile were the most popular screens, with growth rates of 75% for connected TV, and 53% for mobile.
Average CPMs in the first quarter ranged from USD$6.95 (£4.81) in Spain, to USD$7.69 (£5.33) in Italy, USD$13.34 (£9.24) in France and USD$13.50 (£9.35) in the UK, to the highest CPM in Germany with USD$15.58 (£10.79). The average CPM in the US was USD$9.05 (£6.27).
 When it comes to viewability, StickyADS found that 93% of video ads were seen in full on set top boxes and connected TV. Mobile in-app had a rate of 85%, followed by web at 73%, and mobile web at 61%.
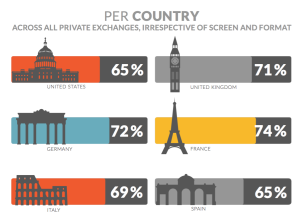
Across all private exchanges, irrespective of device and format, StickyADS compared full video ad viewing stats per country. France led here with 74% of ads seen in full, followed by Germany (72%), and the UK (71%).
The report is based on data collected across the 150+ private exchanges running on the latest version of StickyADS’ sell-side video software.
Ad FraudAd NetworkAdvertiserAnalyticsBrand SafetyDACHDisplayEMEAExchangeMeasurementMedia SpendMobileProgrammaticPublisherTradingViewability


Follow ExchangeWire