European Online Ad Spend Overtakes TV; Industry Professionals Uninformed About Malware
by Sonja Kroll on 14th Jul 2016 in News

ExchangeWire Research’s weekly roundup brings you up-to-date research findings from around the world, with additional insight provided by Rebecca Muir, head of research and analysis, ExchangeWire. In this week’s edition: €36.4bn online ad spend in Europe in 2015; Majority of industry professionals not ready for malware threat; The difference between SVOD and AVOD models; and iOS users spend more money in-app than Android users.
European online ad spend overtakes TV ad spend
Aggregating and comparing data from each national Interactive Advertising Bureau in Europe, the IAB AdEX Benchmark Analysis 2015 finds that, for the first time, online ad expenditure exceeds TV ad spend in 2015.
In 2015, online ad expenditure in Europe totalled €36.4bn (£31bn), increasing 13.0% from €32.1bn (£27.42bn) in the previous year. TV advertising expenditure in 2015 totalled €33.3bn (£28.44bn), making online advertising the biggest advertising medium in Europe.
The highest growth rates within the online ad market was recorded by display. Outperforming all other online advertising formats with a growth rate of 17.2%, display totalled €13.9bn (£11.87bn) in 2015. Within display, the online video advertising market grew by 35.8% year-on-year, raking in a total of €2.3bn (£1.96bn) in 2015. Mobile display advertising grew even stronger at a massive 60.5% to €3.5bn (£2.99bn) and now accounts for more than a quarter of the display market (26.7%), making mobile a key driver of European online ad spend in 2015.
"Online advertising continues to grow double-digit despite its maturity”, summarises Daniel Knapp, director of advertising research at IHS Technology and author of the research. “The deployment of new video inventory, more engaging creative formats, better measurement, and automation have enabled the industry to react to, and monetise, rapid media consumption changes.”
According to the IAB, the European online advertising market has grown from €6.6bn (£5.64bn) in 2006 to €36.4bn (£31.09bn) in 2015, adding almost €30bn (£25bn) to its market volume within 10 years. Translated into a growth rate, these figures show a compound annual growth of 20.9%.
The largest online advertising markets in 2015 were the UK, Germany and France, raking in €11.8bn (£10bn), €5.8bn (£4.95bn), and €4.2bn (£3.59) respectively, and accounting for almost two thirds of the European ad market (60.1%). The three markets which recorded the highest growth were Ireland with 29.0% growth, Bulgaria with a 22.3% increase, and Poland with 21.8% growth.
For the first time since the inception of the IAB Europe AdEx Benchmark, no market grew above 30.0%, a sign of maturing for the online ad market.
Only 19% of industry professionals feel well-informed about malware
The Media Trust, in conjunction with ExchangeWire, has found that less than one-fifth (19%) of industry professionals feel they are "very well-informed" about the threat of malware. In a study among 138 industry insiders, non-publishers (brands, ecommerce companies, DSPs, SSPs, ad exchanges, and media agencies) consider themselves more educated about malware, compared to 10% of the publisher group (including ad networks).
With two-thirds (65%) of respondents reporting they are "somewhat informed" and 16% stating they are "not well-informed", the conclusion is that industry trade groups need to increase their efforts to provide more education, and outline tangible best practices for combating malvertising.
Delving deeper into the study, overall, industry professionals based in the US are the most likely to report being "very well-informed" (40%) and just 3% of respondents saying they are "not well-informed". The French are by far the least confident in their ability to protect themselves – none of the respondents in either the publisher or non-publisher group report they are "very well-informed" and a third say that they are "not well-informed", more than double the figure of any other market.
However, respondents in all markets are aware that web-based malware affects all types of digital properties. Globally, study participants responded that they believe that more than one-in-four publisher and ecommerce websites suffer from malware threats (44% and 42%, respectively), a pattern that is repeated when looking at the two segments’ perception of malware threats against publisher websites: US publishers think 63% are at risk and German publishers believe this figure is less than half that (29%).
US and UK publishers believe ecommerce is more susceptible to malvertising; whereas all other groups (publishers from France and Germany and non-publishers) feel that both publisher and ecommerce sites are equally affected.
Asked about the impact of malware on mobile and desktop, 67% of US respondents, more than half of all respondents in Germany (58%) and the UK (52%), and the global publisher group (58%) believe "malware is less of a problem on mobile websites compared to desktop". However, less than a third (30%) of respondents in France share this belief.
Overall, the majority of all respondents believe that web-based malware attacks are on the increase: 81% of UK publishers and non-publishers believe so, as does the vast majority (92%) of German respondents from non-publisher organisations. Despite this knowledge, only a third of publishers globally are very confident that their organisation is able to combat malware effectively and only 20% are "very confident" that their websites are safe from malware threat.
Click here to read the full report.
SVOD vs AVOD
With the rise of video on demand services, monetising models are under scrutiny. Ooyala's Global Video Index Q1 2016 looks at how consumption of AVOD and SVOD assets differ, i.e. the relation between content length and user engagement, and the consequences of consumption habits for ad monetisation.
Subscription-based VOD was conducted slightly more via smartphones and mobile devices than PCs: combined, smartphones (44%) and tablets (11%) made up more than half (55%) of all SVOD views. Looking at ad-based VOD viewing, PCs receive 55% of video views, smartphones 39%, and tablets 6%.
Ooyala interprets the patterns to indicate that watching premium content delivered via subscription services may be a more personal viewing experience and, therefore, more broadly viewed on personal devices.
According to the study, SVOD content is mostly long-form (of 20 minutes length or longer) and has the majority of viewing times: on smartphones, tablets, PCs, and connected TVs, long-form’s share of SVOD viewing time ranges from 97.7% for smartphones to 99.9% for connected TVs.
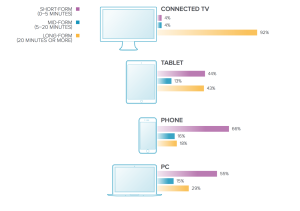 When it comes to ad-based VOD, however, viewing times present a more complex picture. While bigger screens generally get longer viewing times, the share of time watched varies greatly by device: long-form content performs best on large screens, such as connected TV (92%), while short- and mid-form content only receives 4% each. On smartphones, short-form content rules: 66% of AVOD is taken up by short clips, while mid- and long-form are head-to-head with 16% and 18%, respectively. Long- and short-form AVOD content works equally well on tablet devices, garnering 44% (short-form) and 43% (long-form), leaving mid-form content at 13%.
In terms of the best monetisation strategy, the research remains inconclusive: consumption of premium content continues to grow on all devices and for all forms: short, medium, and long.
iOS users more likely to spend money in apps than Android
Based on their own data on in-app purchase behaviour of more than 100 million mobile app users across over 1,000 apps, AppFlyer’s State of In-App Spending report reveals that iOS users spend nearly 2.5 times as much as Android users. In the US, iOS users forked out USD$1.08 (£0.83) per user, per app, per month, as compared to USD$0.43 (£0.33) for Android users.
The average purchase amount is USD$12.77 (£9.84) on iOS, USD$6.19 (£4.77) on Android and USD$8.80 (£6.78) overall; 7.1% of iOS users make at least one payment per month; 4.6% of Android users do. As such, iOS users are about 50% more likely to spend money in apps than Android users, AppFlyer concludes.
North American users spend the single highest amount via apps – and, more specifically, in shopping apps. But, compared to the rest of the world, Asian users spend 40% more on in-app purchases, with a monthly average of USD$0.70 (£0.54) per user, per app.
On a general level, only 5.2% of users spend money on in-app purchases at all. However, once the dam has broken, and users are comfortable with spending money in-app, the average paying user spends USD$9.60 (£7.40) in monthly transactions per app with purchase activity, AppFlyer finds.
“Our data shows that in-app spending continues to present a significant opportunity for app publishers and marketers. While only a small portion of app users actually spend money on in-app purchases, app developers and marketers can capitalise by ensuring they always offer an optimal in-app experience, and by constantly measuring and optimising their activities in order to build a strong base of loyal, valuable users”, says Ran Avrahamy, VP marketing, AppsFlyer.
The average monthly in-app spend for gaming apps is USD$0.32 (£0.25); for shopping apps it is USD$2.68 (£2.06).
The total spend analysed in AppFlyer’s report was USD$300m (£231m) worth of in-app transactions.


Follow ExchangeWire