456% Increase in RFPs Including a Video Ad Component; Mobile Marketing Costs Down 31% in May
by Rebecca Muir on 9th Jul 2015 in News

ExchangeWire Research’s weekly roundup brings you up-to-date research findings from around the world. In this week’s edition: 456% increase in RFPs including a video ad component; Mobile marketing costs down 31% in May.
456% increase in RFPs including a video ad component
The percentage of agency RFPs in the UK that include a video ad component is up 456% since 2011, reflecting the rapid growth in video adspend. Today, 25% of agencies include a video ad component in the majority of RFPs. These findings come from research released this week by BrightRoll who conducted a similar study in the US. There is a stark difference between the two markets with almost double (48%) of US agencies reporting a video component in the majority of RFPs.
Completed views (31%) and brand lift (28%) were revealed to be the most important performance metrics for video campaigns in the UK. It is encouraging to see the measurement of video campaigns evolving from performance metrics e.g. CTR, to engagement metrics. However, many platforms autoplay video ads and media buyers need to show caution when evaluating the success of a campaign and not rely solely on play-based metrics that are easily distorted. In the US, conversions were cited by 18% of respondents as being the most important success criteria, compared to only 8% in the UK.
The study does not discuss how conversions are being measured and attributed but from a marketing perspective; we would hope that measurement of conversions and therefore evaluation of success is part of a full-funnel attribution model. Without such a model in place, it is unlikely that many conversions will be attributed to video ads as they are typically found in the awareness stage (or upper funnel). If judged on a last-click attribution model, video will appear weak compared to channels such as search which often provides the last click before a conversion.
Targeting capabilities were cited by 44% of respondents as the most valuable aspect of digital video, followed by reach (33%) demonstrating the importance of audience quality to marketers. This trend was reflected in the US findings too.
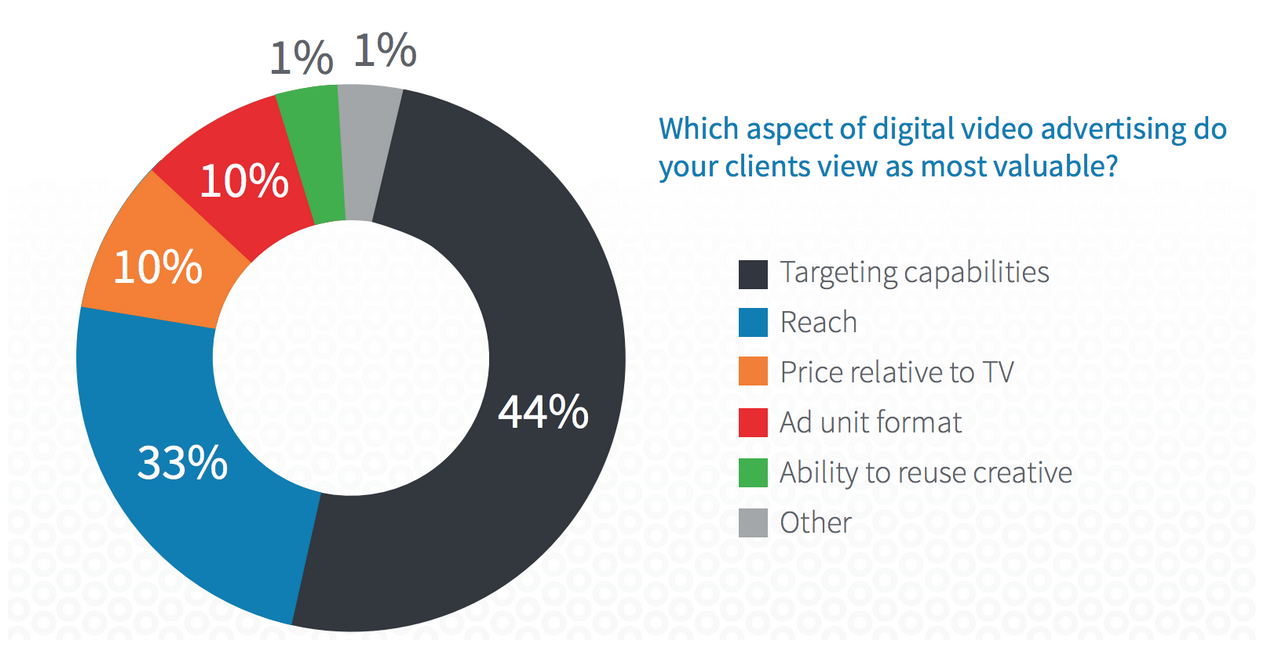
Source: BrightRoll Advertising Agency Survey
Mobile video is expected to show the highest rate of growth in the UK this year, with almost two thirds of agency respondents in agreement (65%). A similar rate pattern of growth is expected in the US, with 60% of agency respondents agreeing that mobile video is where they expect the largest increase in digital media spend.
Mobile marketing costs down 31% in May
Mobile is a sector of advertising plagued by lack of effective, holistic measurement. It is technically difficult to match desktop IDs to mobile IDs, meaning that advertisers struggle to merge data and accurately paint the cross channel picture. Instead, advertisers rely on what they know to be true: consumers engage with brands across mobile and desktop devices; mobile advertising increases brand awareness; the performance of mobile advertising and marketing can be evaluated using mobile-specific metrics, such as cost per install (CPI) and cost per loyal user (CPLU).
The Fiksu Index reveals that cost per install (CPI) fell by 31% in May to $1.46 on IOS. On Android, CPI continued to rise to $2.33, a 12% increase from April, and a 93% increase from last year. Although the CPI figures for Apple and Android appear to be disparate, this can be attributed to the fact that the CPI metric includes incentivised spending. Incentivised spending networks are far more effective and numerous on IOS, effectively lowering the cost per install. The cost per launch (CPL) Index, which tracks the cost of driving mobile app engagement, fell by 31% on iOS to $0.28 in May, a 13% year on year rise.
A notable decline was seen in app download volume in May, with Apple’s adjustment to the games section of the App Store influencing this decline. In May, Apple shifted from producing algorithmically generated top 200 lists, to curating lists based on editorial content allowing consumers to discover more apps. Cost per loyal user (CPLU) decreased by 10% in May to $2.47, a welcome relief for marketers who have seen a steady rise in costs throughout 2015. CPLU remains 39% more expensive than last year. However, this month's data shows that brand spend is undergoing a shift, with brands increasingly employing mobile DMPs to tap into targeted pool of consumers. The use of mobile DMPs drives consumer loyalty and spending, but leads to a decrease in volume.
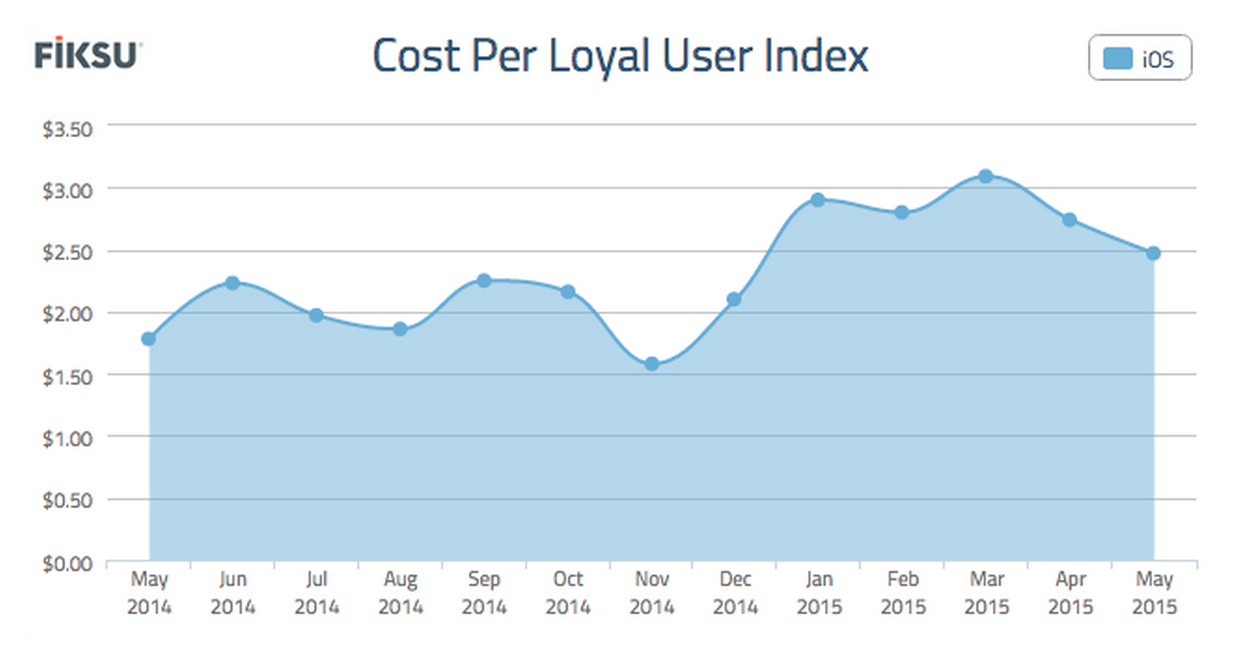
Source: FIKSU May CPI metrics
AgencyattributionBrandingCross-ChannelDigital MarketingExchangeWire ResearchMobilePerformanceTargetingVideo


Follow ExchangeWire